

Claude Code 35: Do AI Agents Writing Full Manuscripts at the Social Catalyst Lab P-Hack?
In a nutshell: they absolutely do!

In this post, I used Claude Code to extract all 651 papers written by AI Agents at the Social Catalyst Lab’s APE project. These papers were fully automated with no human guidance. They are program evaluation papers, meaning they estimate causal effects with real data using R scripts and modern econometric methods. Additionally, they are manuscripts presenting that information with words, pictures and tables. In this substack, I will walk you through what I learned when I sent all 651 of them to OpenAI for analysis purposes along many dimensions, with the main goal being to answer this question: what do AI agents think humans think is the underlying rhetoric for communicating program evaluation findings to audiences in today’s day and age?
The main questions I’m going to try and pursue though is to classify the papers by research design, estimator, types of data, the kinds of pictures they make, the kinds of tables they make, whether they state an explicit estimand, and whether they p-hack. I did this by sending the 651 AI generated manuscripts repeatedly to OpenAI GPT-4o (not mini but the big boy model) for classification purposes as I found Claude Code repeatedly using unreliable methods for simple classifications, and that sometimes even the metadata that the AI agents wrote about their own papers were wrong. So keep reading to learn more.
Thanks again for all your support of the substack! It is a real labor of love to do this. I say that each time, but what else can you say when that is in fact the truth. It is a labor of love. I love doing this, and it is work, and it takes time. I often write these either after midnight, or before 5am, or both. I am unusually encouraged that so many of you think my approach to learning about Claude Code — via writing about it publicly in the pursuit of practical research tasks — is compelling and interesting. So thank you for your support, both the emotional support and the financial support of being a subscriber to the substack. Consider paying today! It’s only $5/month, which is the lowest price that Substack lets you charge. With it you get some ridiculous number of articles I’ve written (I think it’s 700+ or something) going back to early 2021. They are about causal inference, econometrics, pop culture, and now, artificial intelligence. But the Claude Code series, of which there are now 35 entires, are free initially to everyone (though after four days they go behind the paywall). But let’s get started! Because I have some interesting pictures and analysis to share.
AI Generated Manuscripts on Program Evaluation by the Social Catalyst Lab
Paul Goldsmith-Pinkham posted the other a substack where he noted how common diff-in-diff is on the AI printed papers that the Social Catalyst Lab is running an experiment on. The experiment is called APE and their goal is automate 1,000 papers using AI Agents. Here is Paul’s post of what he found when pulled the papers down from their GitHub and looked into what they were.
Paul’s post got me thinking. I wonder just what we can learn about what AI Agents think that human researchers think about the implied rhetoric of empirical papers? I mean, they have written almost 700 manuscripts at this point. Fully formed, based on real data, real estimators, R scripts that executed and made actual tables of estimates, made actual figures, even included robustness tests. Papers with a thesis, estimating causal effects. Did they articulate a population estimand? When they write a paper using diff-in-diff versus when they write one using RDD, how do these papers appear to differ from one another? Do they show signs of p-hacking like humans do?
The only way I could think to do this, though, was to have clone the repo, and have Claude Code organize the files and submit them to OpenAI in batch requests. There are 651 manuscripts, and while I could’ve just looked at the metadata, what we were learning together in doing that was that the metadata (written by the AI agent about what they thought the paper was doing) was not always accurate itself. Spot checks by two referee2 personas found the AI agent mistakenly calling something one thing that was another. Therefore I opted to send al 651 manuscripts to OpenAI to be more formally analyzed. For this I decided to pay top dollar too — not gpt-4o-mini, but gpt-4o. Claude said going up to 4.1 wasn’t probably worth it, so I didn’t.
Breaking down the designs
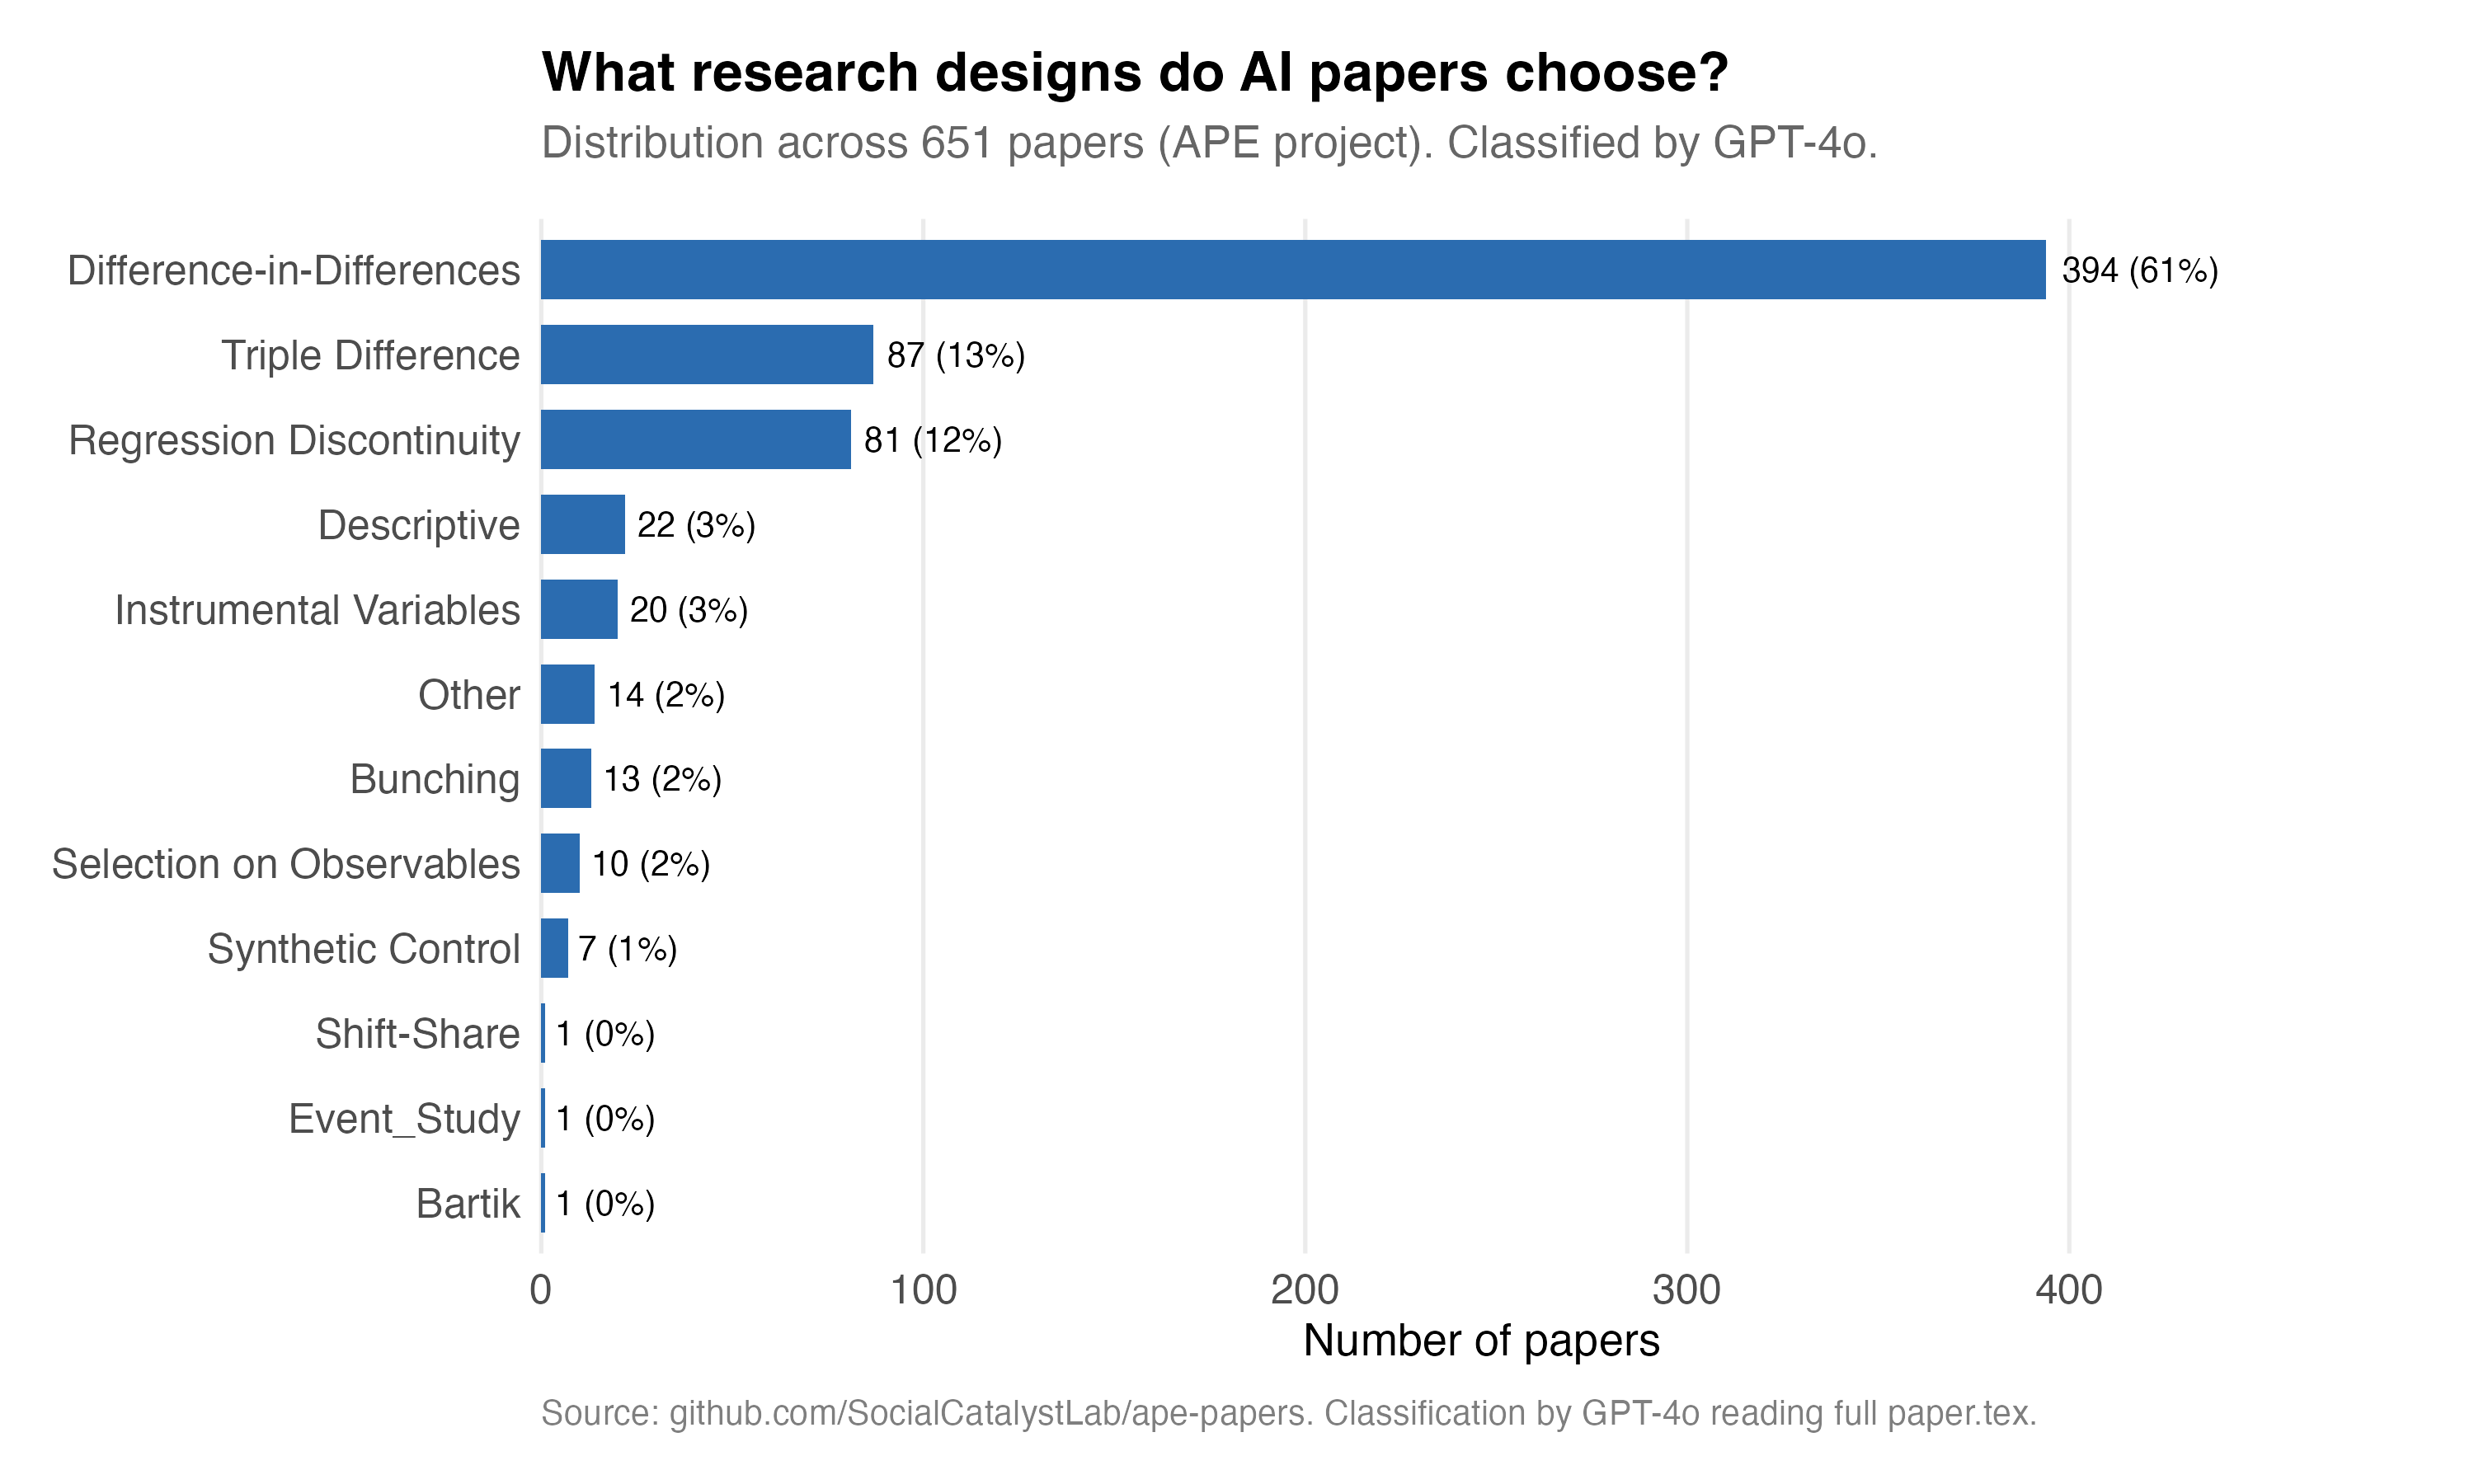
First, I find slightly different things than what Paul found, but note that this is not actually “me” finding anything. This is what OpenAI’s gpt-4o classification said after reading the article without any training whatsoever (“zero shot”). And I find 61% did vs Paul finding 70%. GPT also classified 87 of the papers as triple diffs, which is interesting given I did not give triple diff as a possible category. Still, I’m not sure, because look at the ways that the estimators vary for the diff-in-diff versus the triple diff papers.
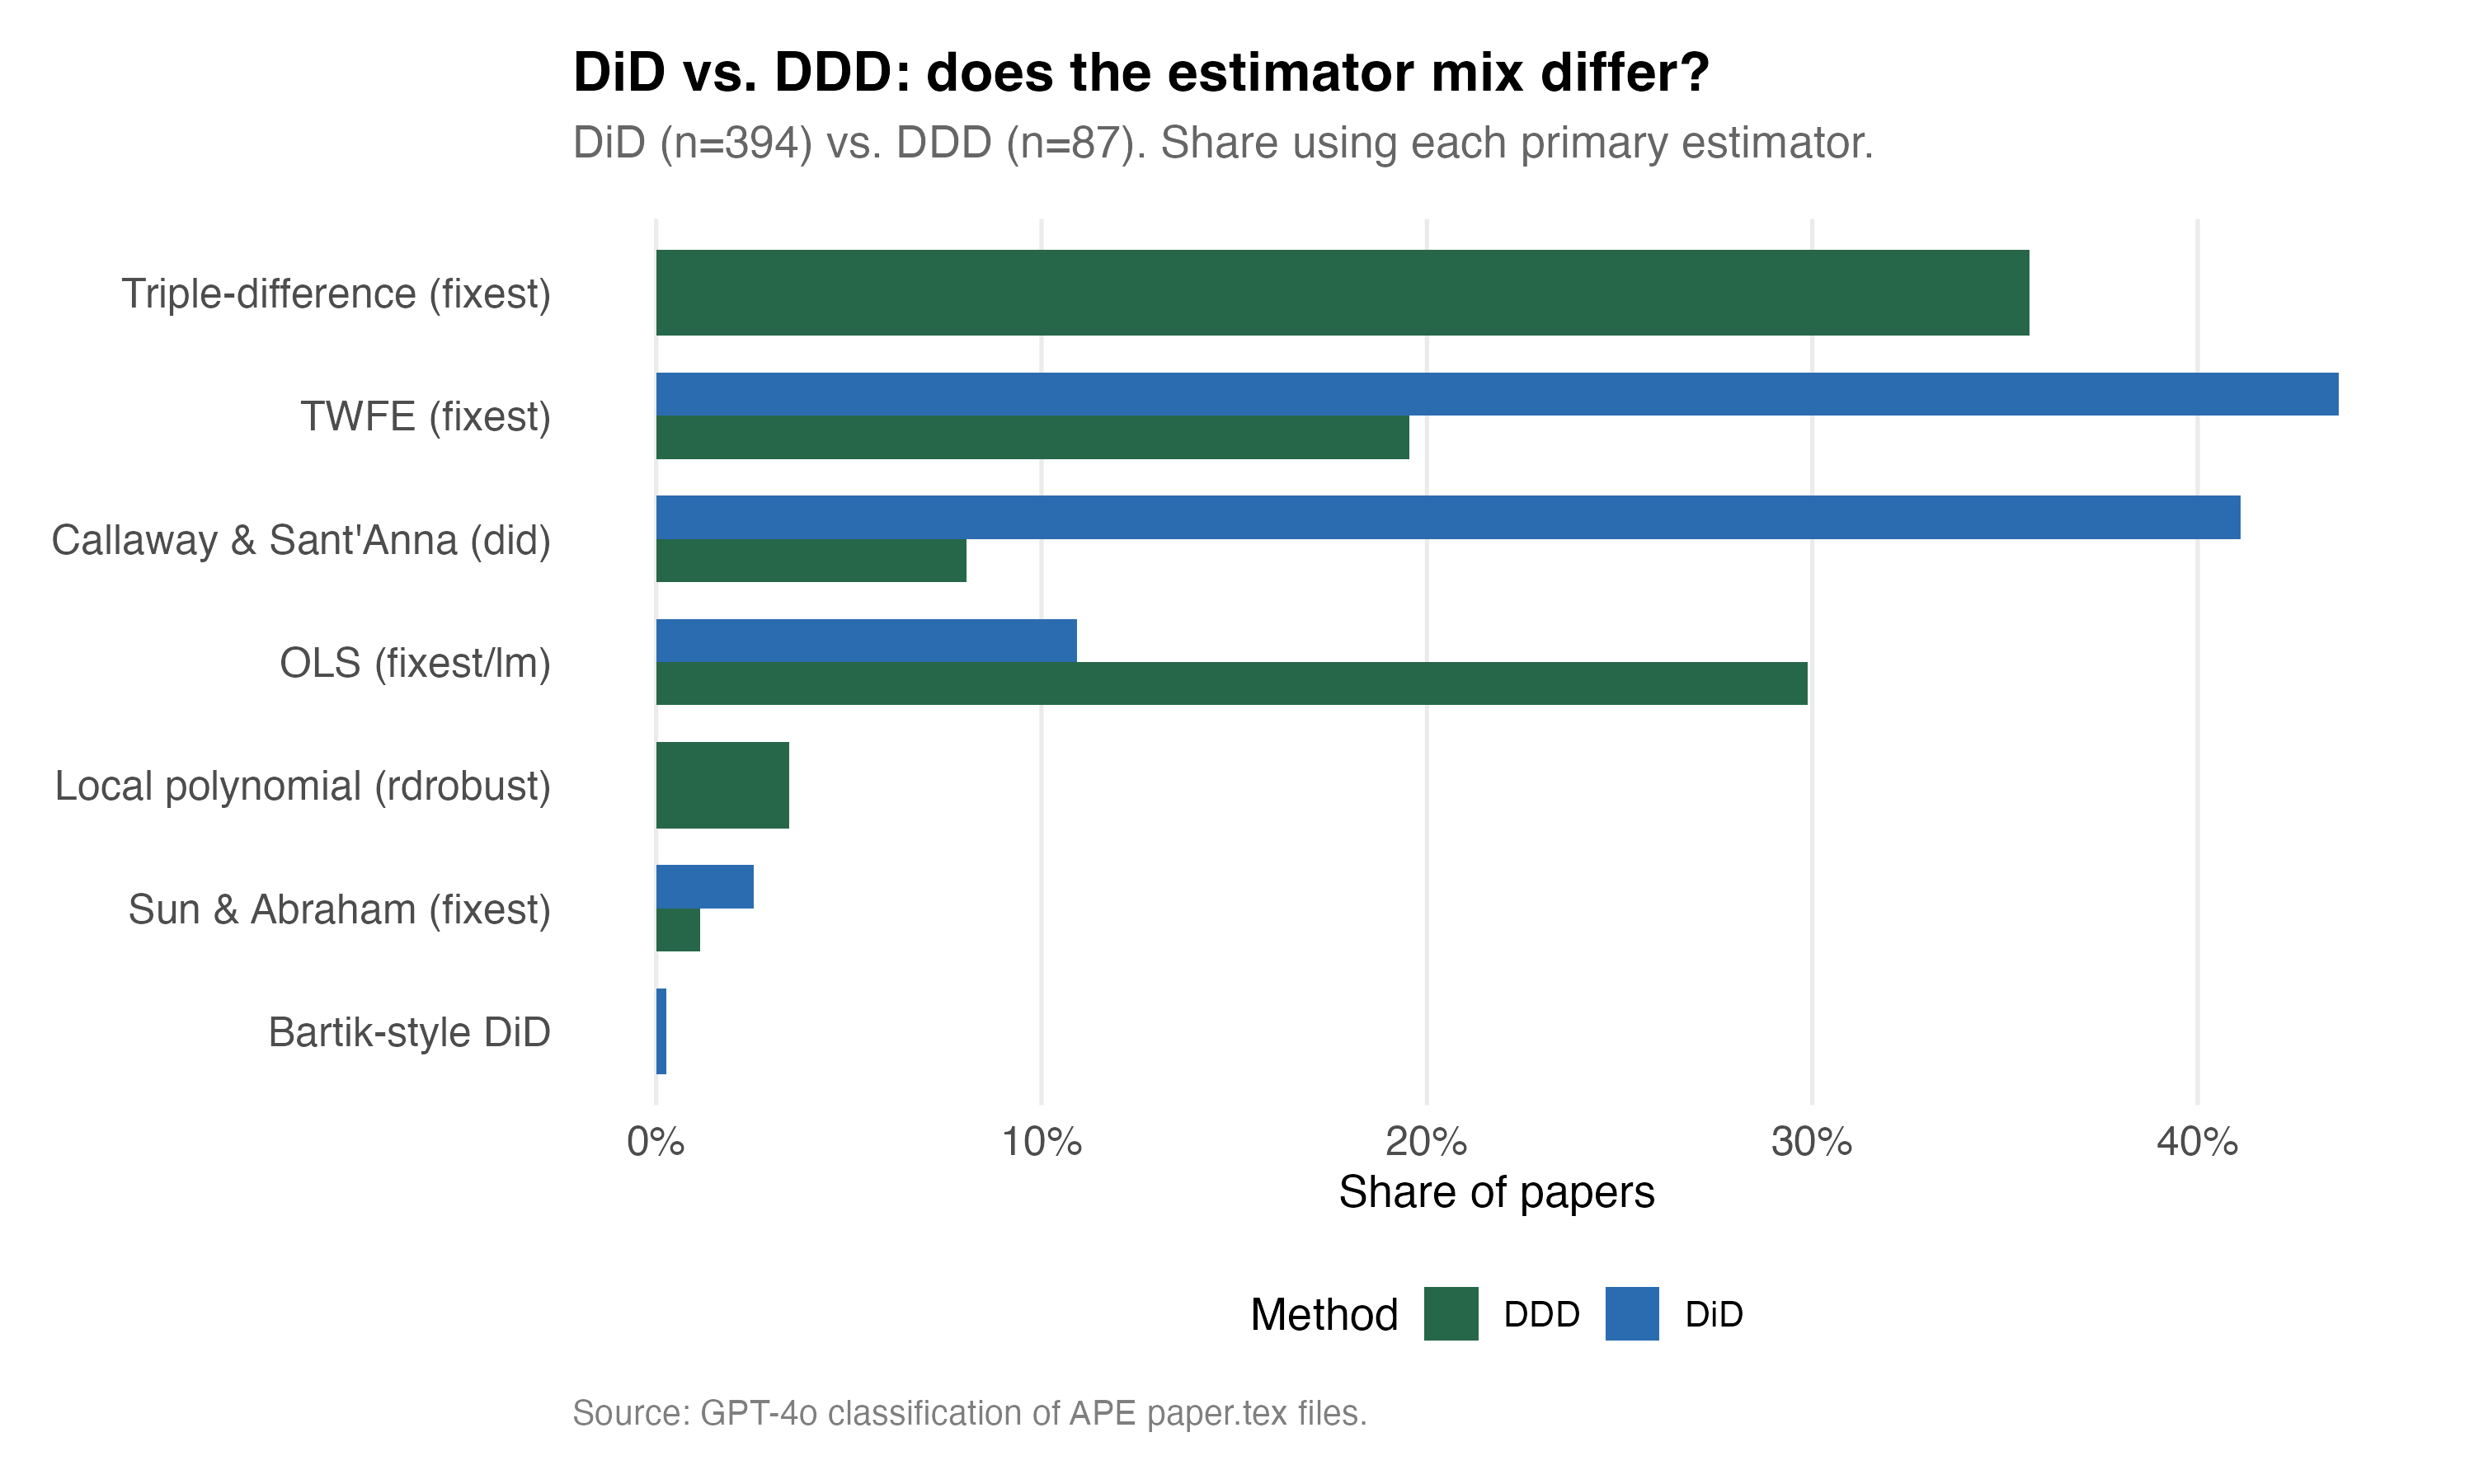
The Callway and Sant’Anna is not the most common, but it’s close. Over 40% of the DiD papers AI was using are using CS, and slightly more are using TWFE. Okay fine. I wasn’t surprised by that. What I am surprised by is that gpt-4o is saying a paper is using triple diff and the methodology used is an RDD estimator, rdrobust. Furthermore, CS does not have a triple diff implementation, so that too is odd.
So, what I did was I asked Claude Code to read those triple diffs using CS and the triple diffs using rdrobust to tell me what is going on. Here’s what is going on. There are 7 CS DDD papers in the APE dataset. These are papers that GPT-4o classified as triple diff because the research design is triple-diff. They are comparing apparently across three dimensions: treated versus untreated sectors, in adopting versus non-adopting states, before versus after.
Yet weirdly enough, the estimator is CS applied to one of those dimensions. And Claude Code checked for me. The paper titled “apep_0462” runs att_gt() on a staggered treatment, even though the paper’s conceptual design is a triple-diff. GPT-4o nonetheless classified the design as DDD but the estimator as CS, and both are arguably correct. GPT says apparently that the paper thinks of itself as a triple-diff but implements it by running CS on a pre-differenced outcome or a specific subgroup. Which is unorthodox to say the least, and so I asked him to extract the code for me here.
# ── 2. Callaway-Sant'Anna DiD (Quarterly) ────────────────────────────

cat("\n=== Callaway-Sant'Anna: Total Accidents ===\n")

cs_accidents <- att_gt(
  yname = "accidents",
  tname = "t",
  idname = "dep_id",
  gname = "first_treat_q",
  data = as.data.frame(panel),
  control_group = "nevertreated",
  anticipation = 0,
  base_period = "universal"
)

agg_overall <- aggte(cs_accidents, type = "simple")
So in reality though GPT-4o called this a triple diff, it did so because of the design. Apparently, it was a staggered diff-in-diff estimated with CS, because accidents (the outcome here) was by department and the treatment hit the departments at different time periods. And the reason GPT called it a triple diff and not just diff in diff was apparently because the paper’s narrative described itself as comparing departmental roads vs autoroutes within the same department. The third difference needed for the triple diff was actually a conceptual framing the AI made about the paper itself, not the estimator.
The rdrobust ones have similar things. These are 3 papers and what they actually are is not a traditional RDD, but rather a “difference-in-discontinuities” design. The manuscript called apep_0611 literally says “RDD and diff-in-disc estimation.” So what apparently happened is that GPT-4o classified the design as triple diff because it’s differencing across a discontinuity. Recall that the diff-in-disc is an RDD run twice — once before the policy change, once after, and then differenced. But the estimator they used was rdrobust. This is no doubt a judgment call, as it could be either RDD or DDD, but GPT thought best to call it triple diff.
So that’s kind of what is going on in these papers. Their classifications according to GPT are based on the rhetoric of the paper itself, not just the estimator.
Data Visualization
Modern causal inference is extremely visual. RDD papers show plots of outcomes along the running variable. Diff-in-diff papers show event study coefficients with 95% confidence intervals. IV papers often show both the numerator and denominator representations of the Wald estimator — a graph of the first stage, a graph of the correlation between the instrument and the outcome. And obviously synthetic control is nothing but pictures.
So then, what do the AI Agents who wrote the 651 papers at APE do in their causal studies? They also make pictures, and here are the kinds of pictures they make.
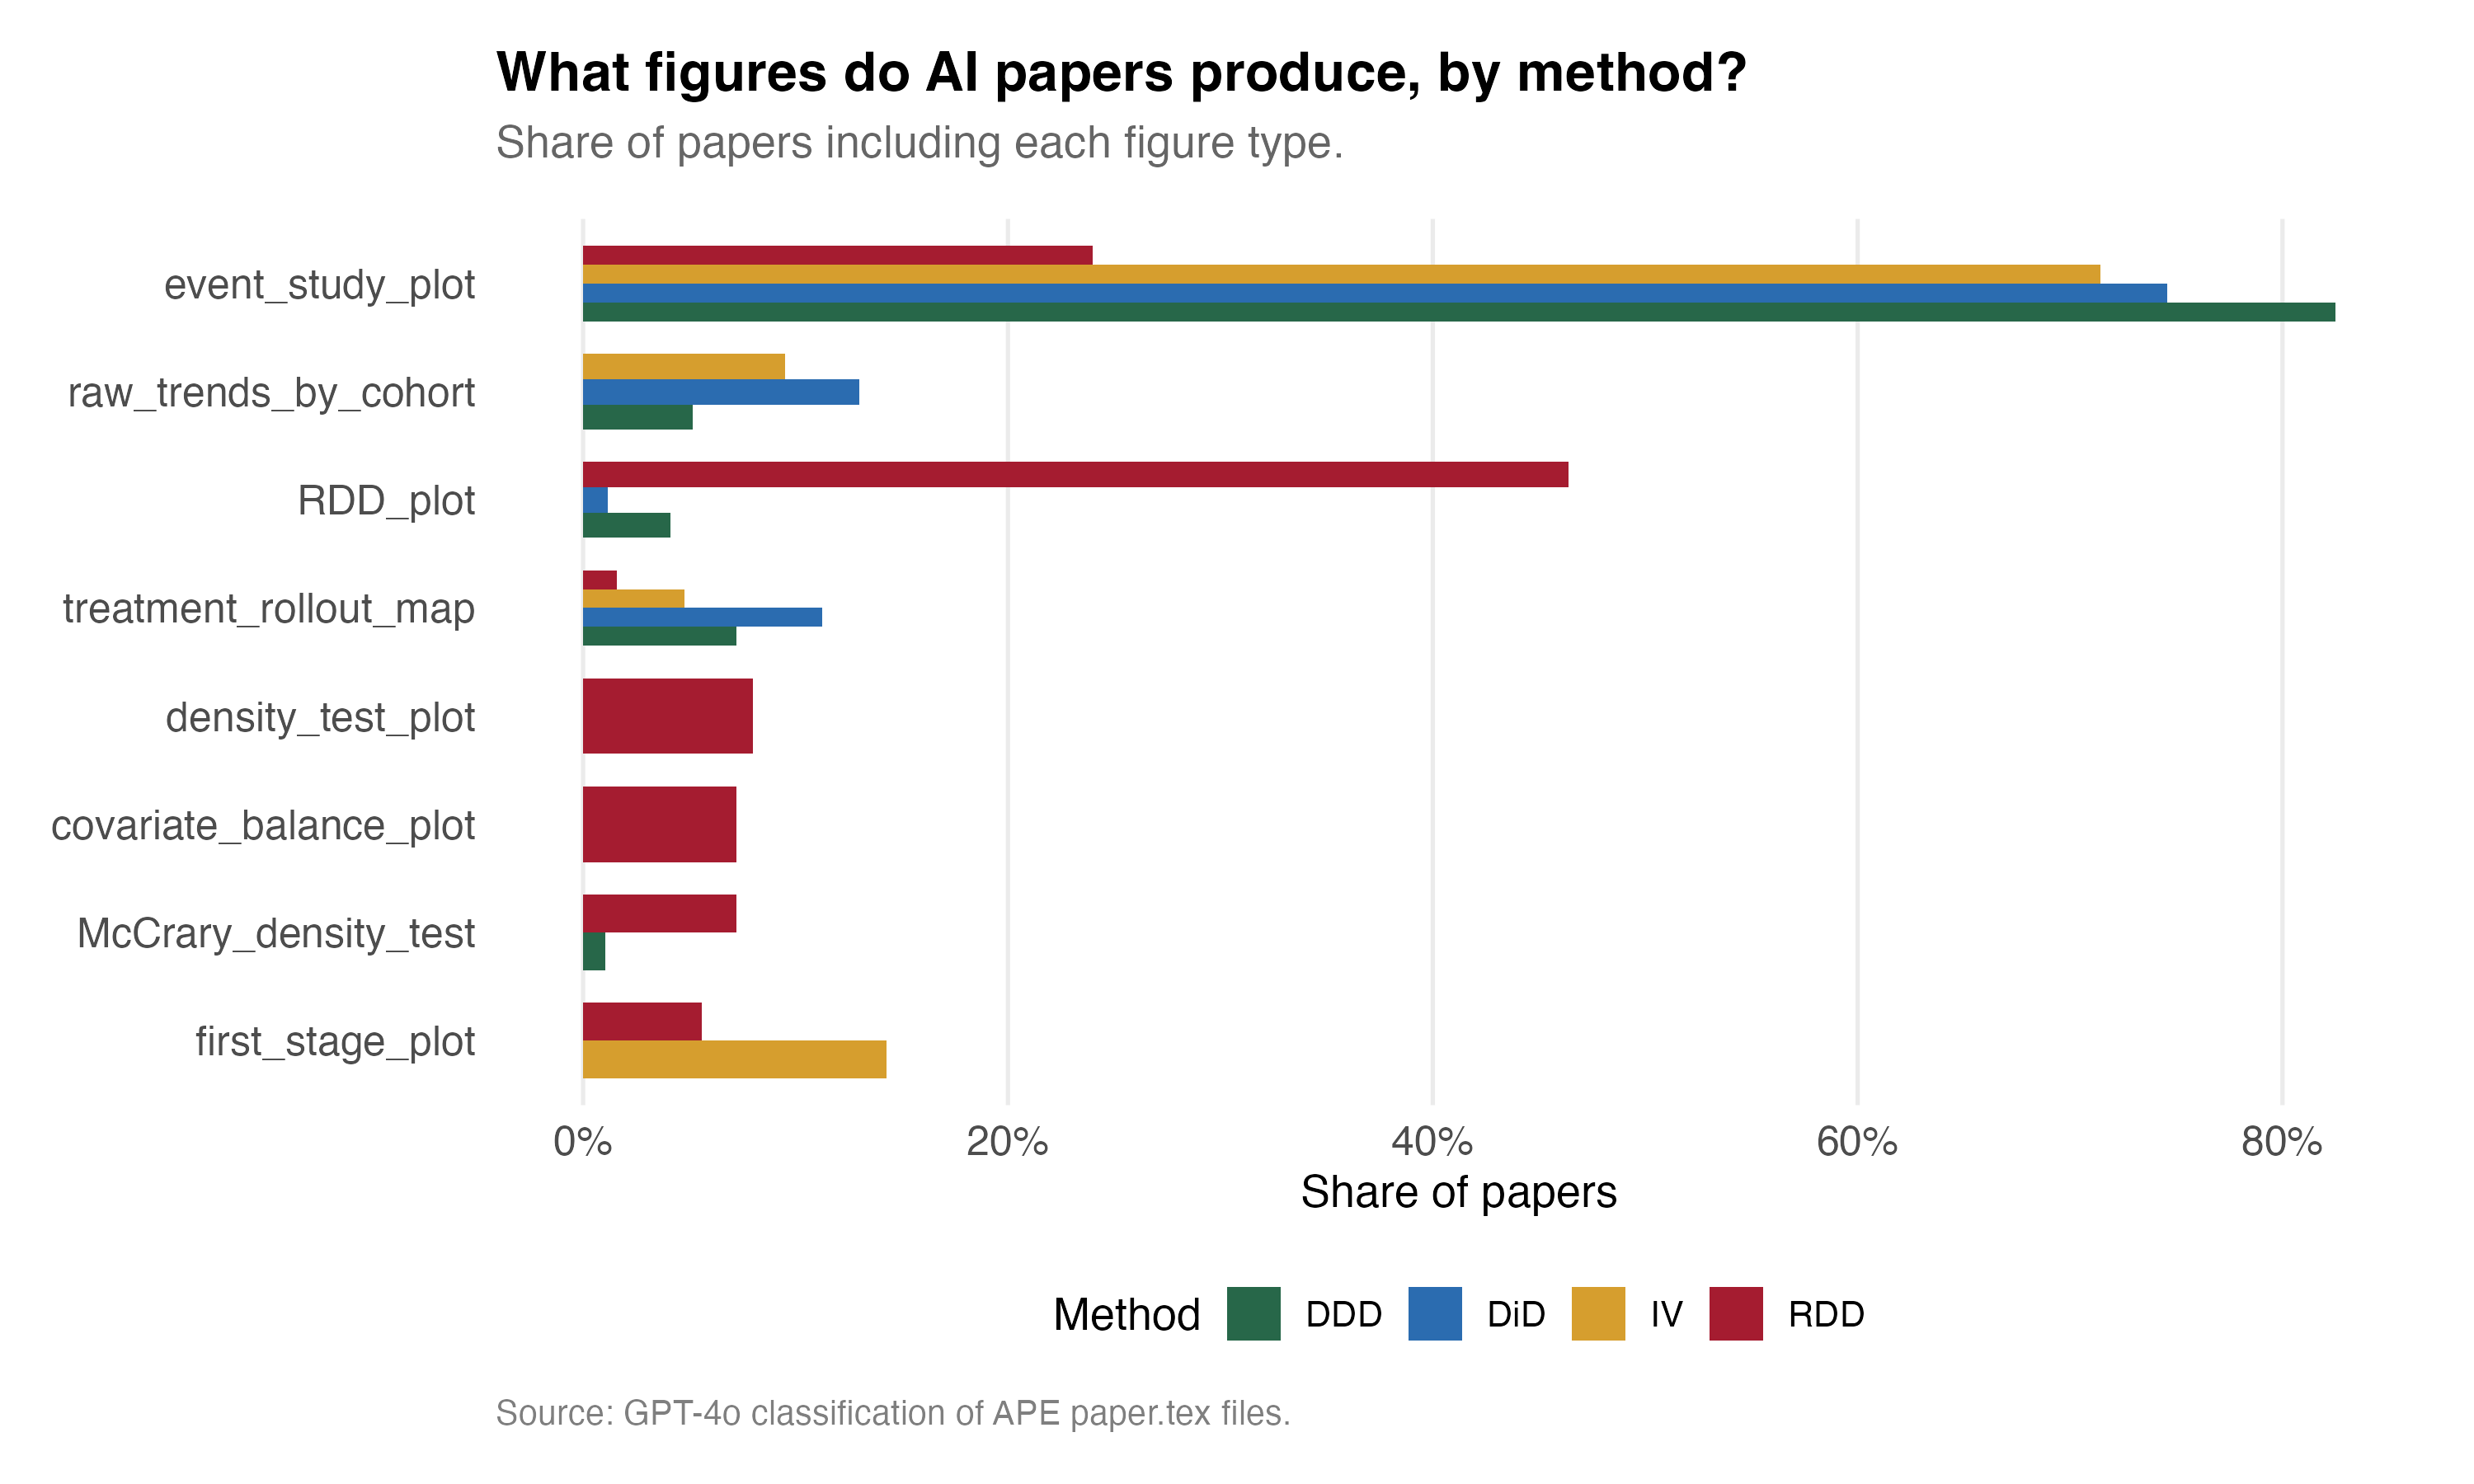
It is both surprising and not surprising at all that overwhelmingly, the triple diff and diff-in-diff papers use event study plots. It is almost disqualifying to be either of those and not do so. But that said, over 80% of the triple diffs are showing event study plots, and given I’ve literally never seen one triple diff event study plot except for the ones I have included myself in my book, Causal Inference: the Remix, that comes out this summer, that seems unreal. I definitely want to pull those pictures out. My hunch tells me that these are the event studies for the diff-in-diff, not the event study coefficients on the triple interaction. But I’d need to dig into that more, and I will — just not now.
Interestingly, both RDD and IV show first stage plots. RDD shows a density test (as does at least one triple diff? I gotta read these innovative triple diffs!). RDD shows covariate balance plots and again density tests but not by the Justin McCrary shorthand name for them. You’ve also got treatment rollout maps, which s pretty fascinating to me.
I know I said this was not surprising, but you know what? It is absolutely surprising. Because the Social Catalyst Lab never told these AI agents to do any of this, which means they are able to pattern match on a level that is mind boggling. It knows that in the rhetoric of a diff-in-diff paper, you produce event studies. No, take that back. You estimate them using R and panel data with policy events that vary over time for some but not all units. Just let that sink in — this mindless machine knows to do this.
I think we are too quick to gloss over stuff like this. If this had been the first thing we had learned that AI could do, we would’ve been stunned, but I think we are so accustomed it now that we cannot see it for what it actually is which is downright eerie.
Which Tables Do AI Agents Produce?
We don’t really always think of tables as rhetoric but they are. We used them to communicate to other people in the hopes of persuading them. And over time, through repetition, through successful papers and failed papers, a series of canonical tables are pretty much boilerplate showing up in all our papers — including our causal estimation ones. And here is the distribution of the type of tables that appear in the 651 papers by research design.
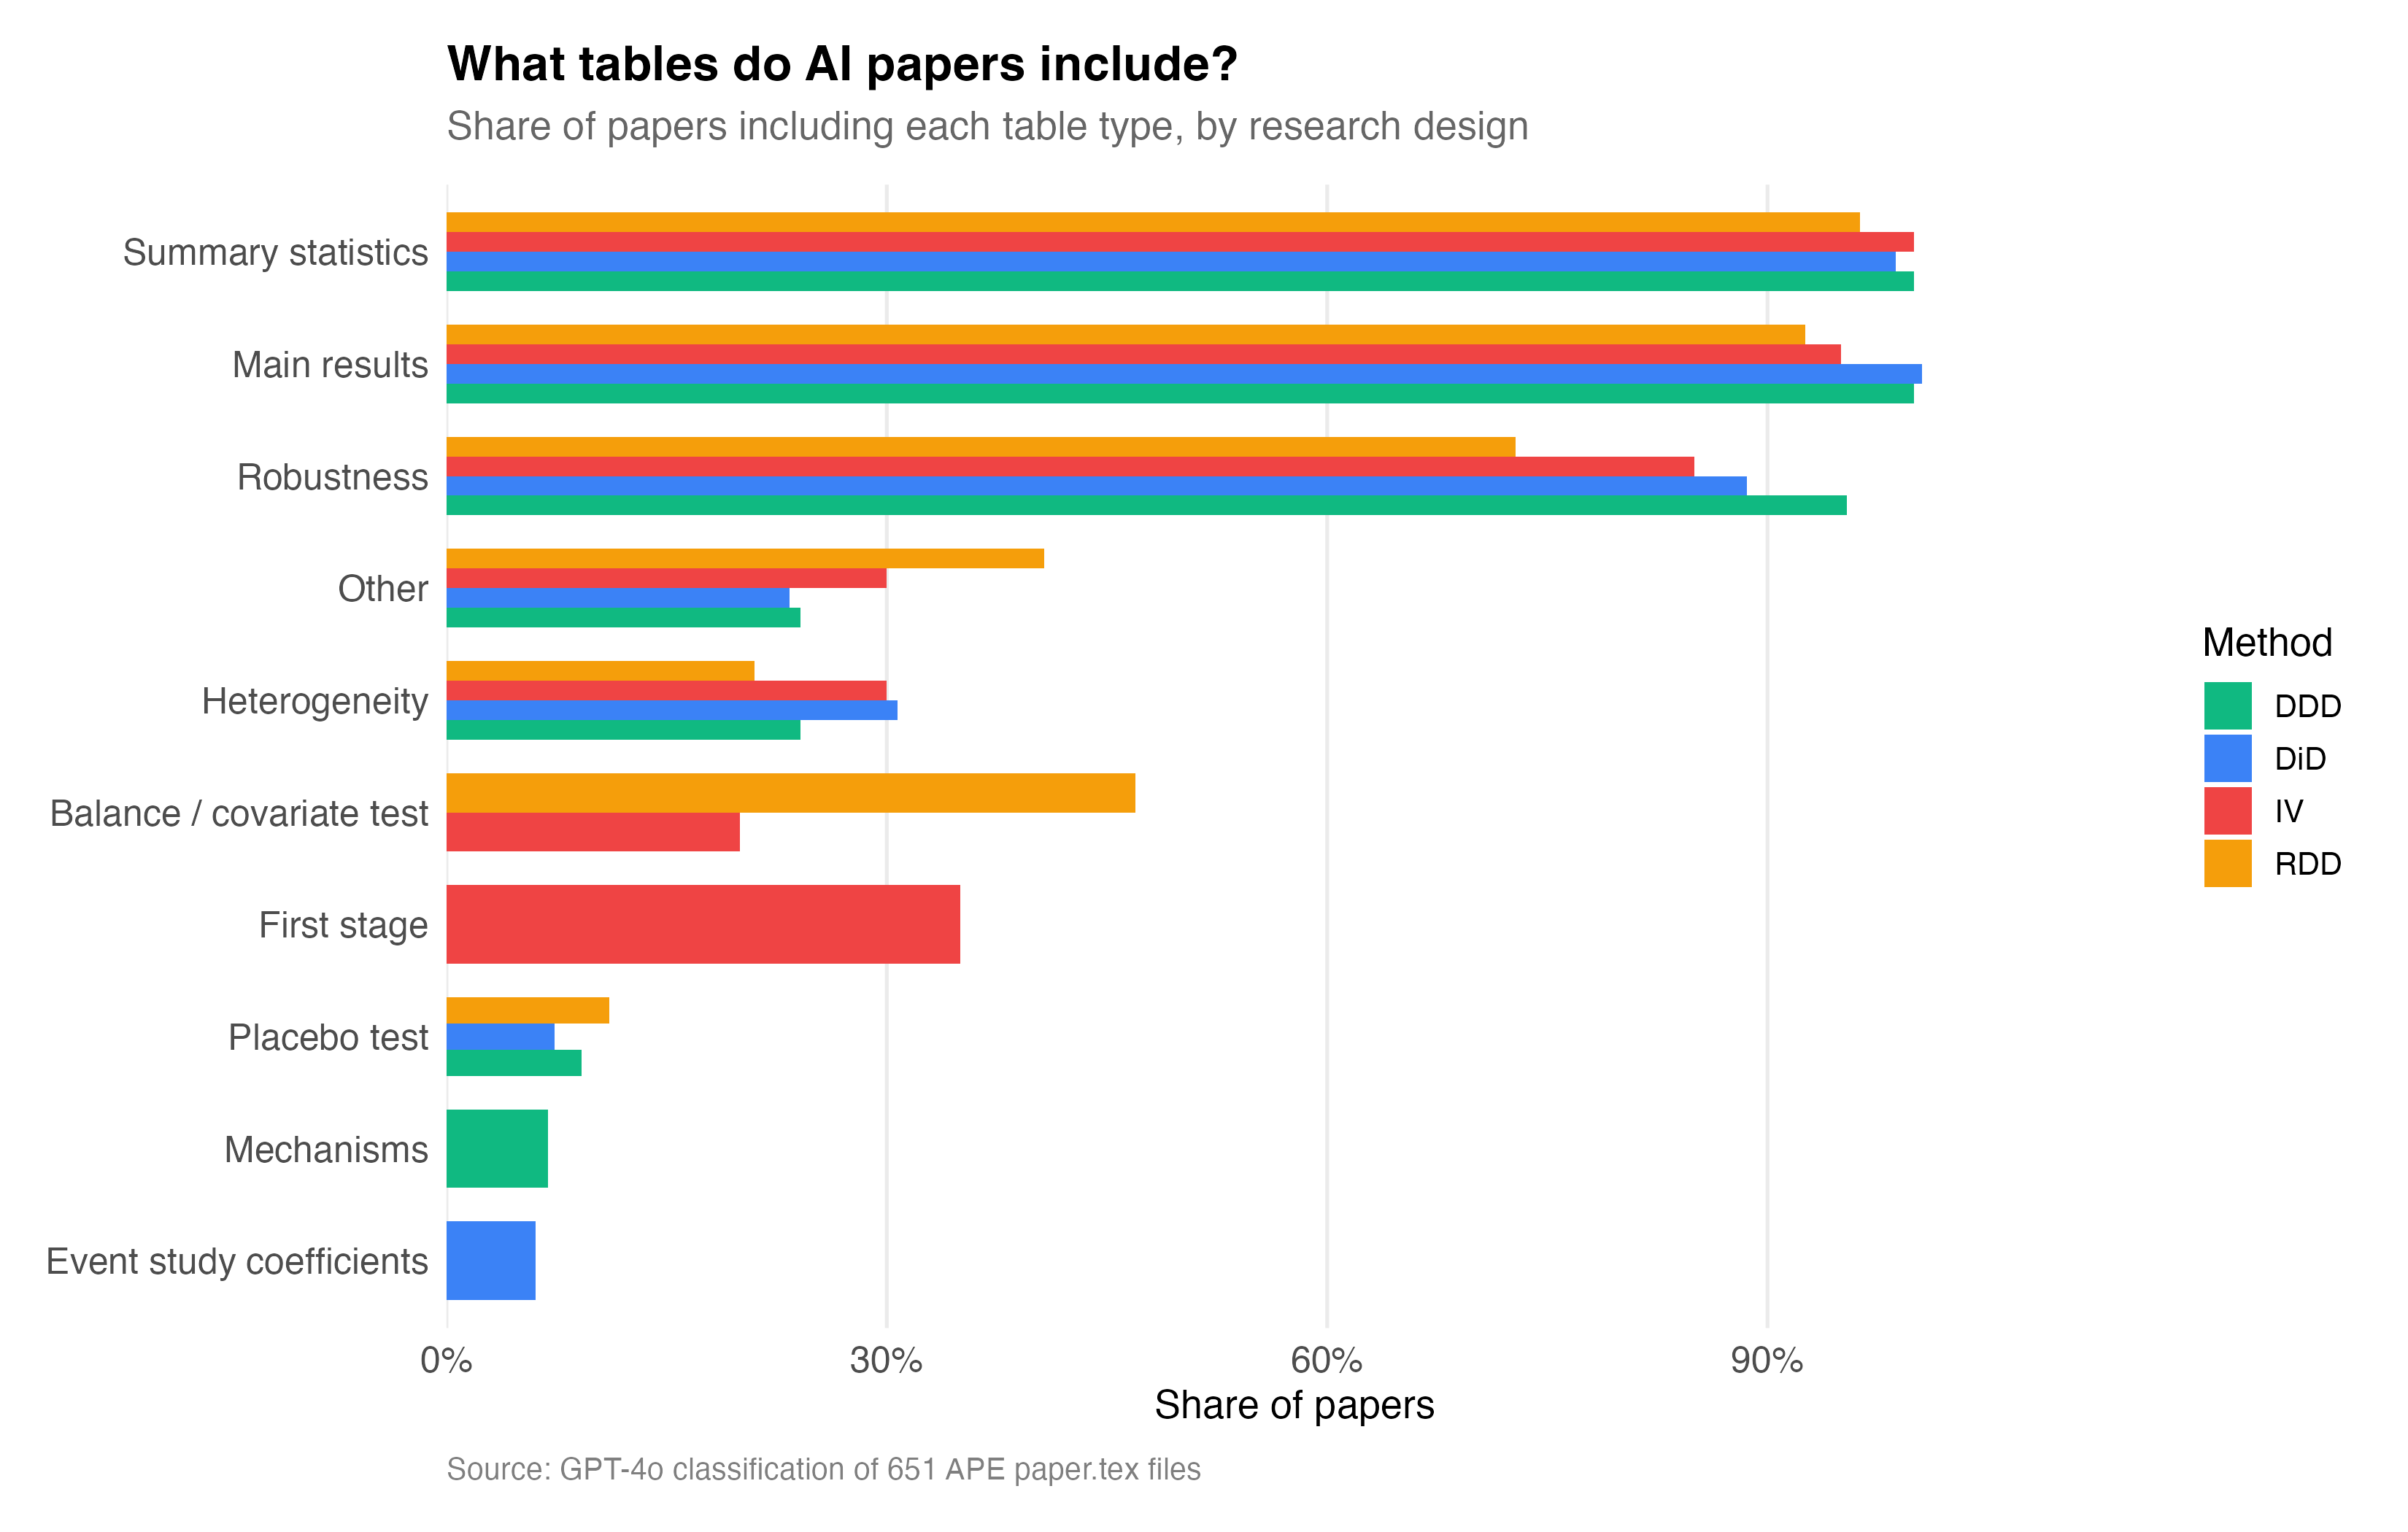
Overwhelmingly, nearly everyone produces summary statistics, and of course they produce a table called “Main results”. But it’s interesting that they also overwhelmingly show robustness as its own tables. Balance covariate tests are very common in RDD, but interestingly less so in DD and DDD. My hunch is that this is due to a somewhat skepticism about covariates role in the diff-in-diff designs, and so even though in our JEL (section 4.2), we discuss covariates at length, and suggest balance tests, I don’t think that is yet the most popular type of table you will see in diff-in-diff.
Interestingly, some of the diff-in-diff papers have tables of event study coefficients. I would jot recommend that, but the fact that it’s here is not surprising as I regularly see it too, and strongly discourage it when I do.
Population Estimand
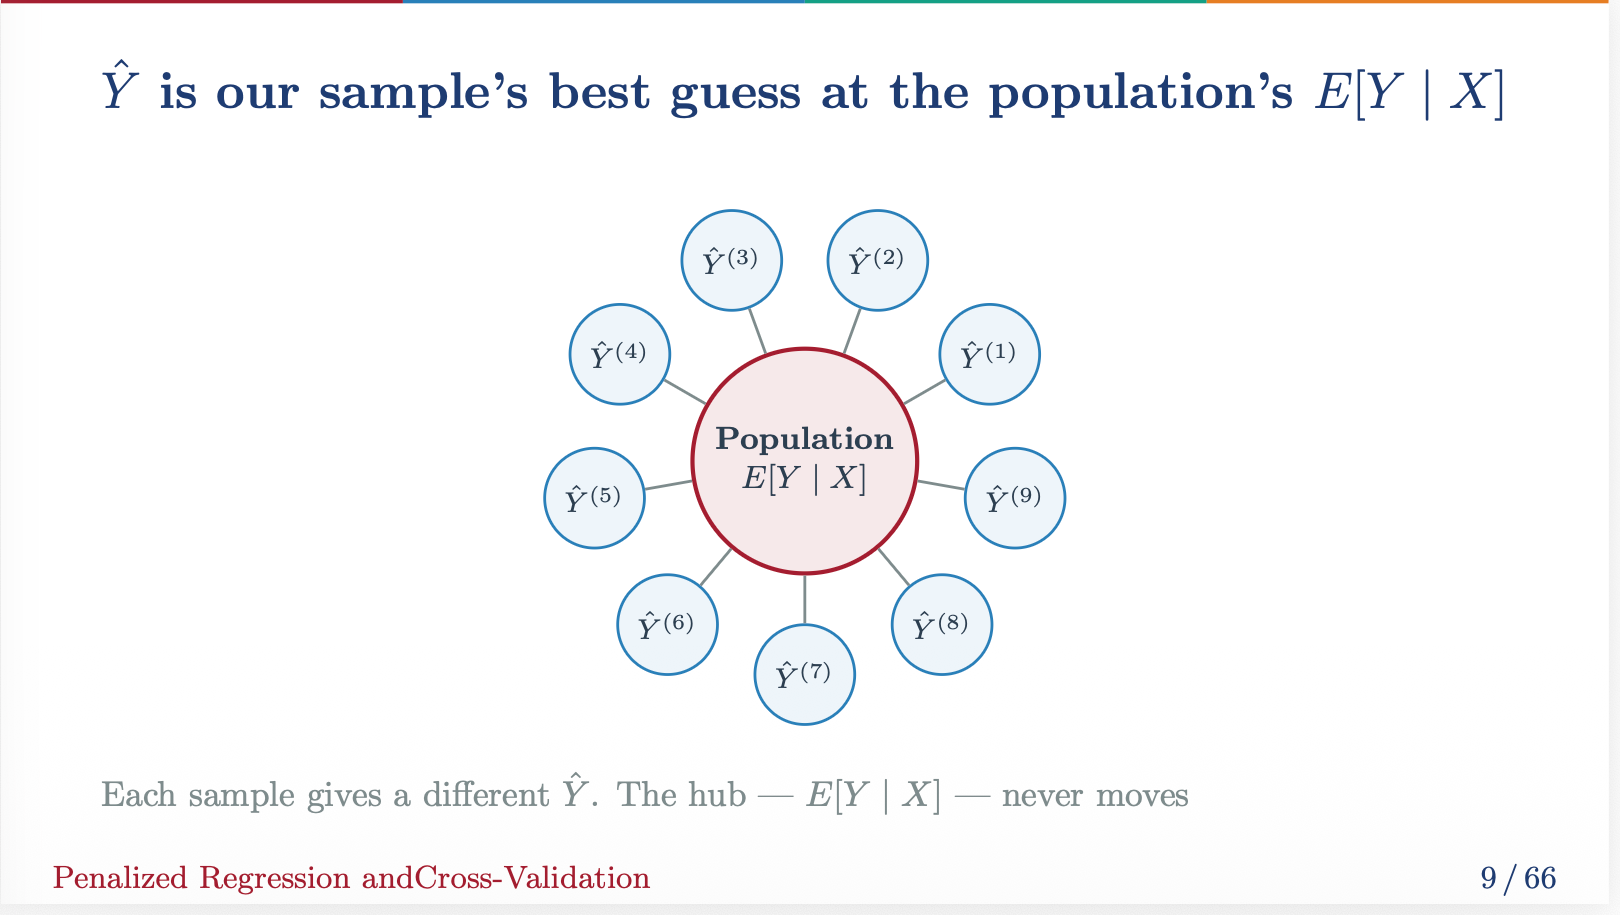
This semester I am teaching two classes at Harvard — an undergraduate stats class called Gov 51 and a PhD class on probability. And in both of them, I have been talking at length about estimands, estimators, repeated sampling, sampling distributions of estimators, and estimates done in a single sample. And I will say this — it is absolutely not something you teach once and then move on from. It is something that you have to teach repeatedly, or that I have to teach repeatedly anyway, and that over time, across weeks even, over problem sets and exams, when things are asked a certain way over and over, you start to see earnest questions asked in class that clearly indicate they understand these things, otherwise they wouldn’t be asking the questions they are asking. And so I use pictures like this a lot for both classes — these hub and spoke pictures to illustrate the population estimand (here the conditional expectation function at the center), the spokes being the single draw from the population creating a sample that is identical in size to all the other samples. And all of these are hypothetical except one — only one of the samples exist. The other are counterfactual samples filled with actual people from the population.
Well, the causal parameters are also estimands. They too sit at the center. Now I won’t go down the rabbit hole now of related sampling versus design based inference. I will just say that every design has associated with it a population estimand, but it has not been historically nearly as common as one things to clearly articulate what it is or how it relates to the sample’s own calculations.
And so I asked GPT-4o — how many of these papers explicitly identify the estimand of interest? And the answer is 81%. 528 out of 651 of the AI generated papers explicitly identify the target parameter, and those are listed here.
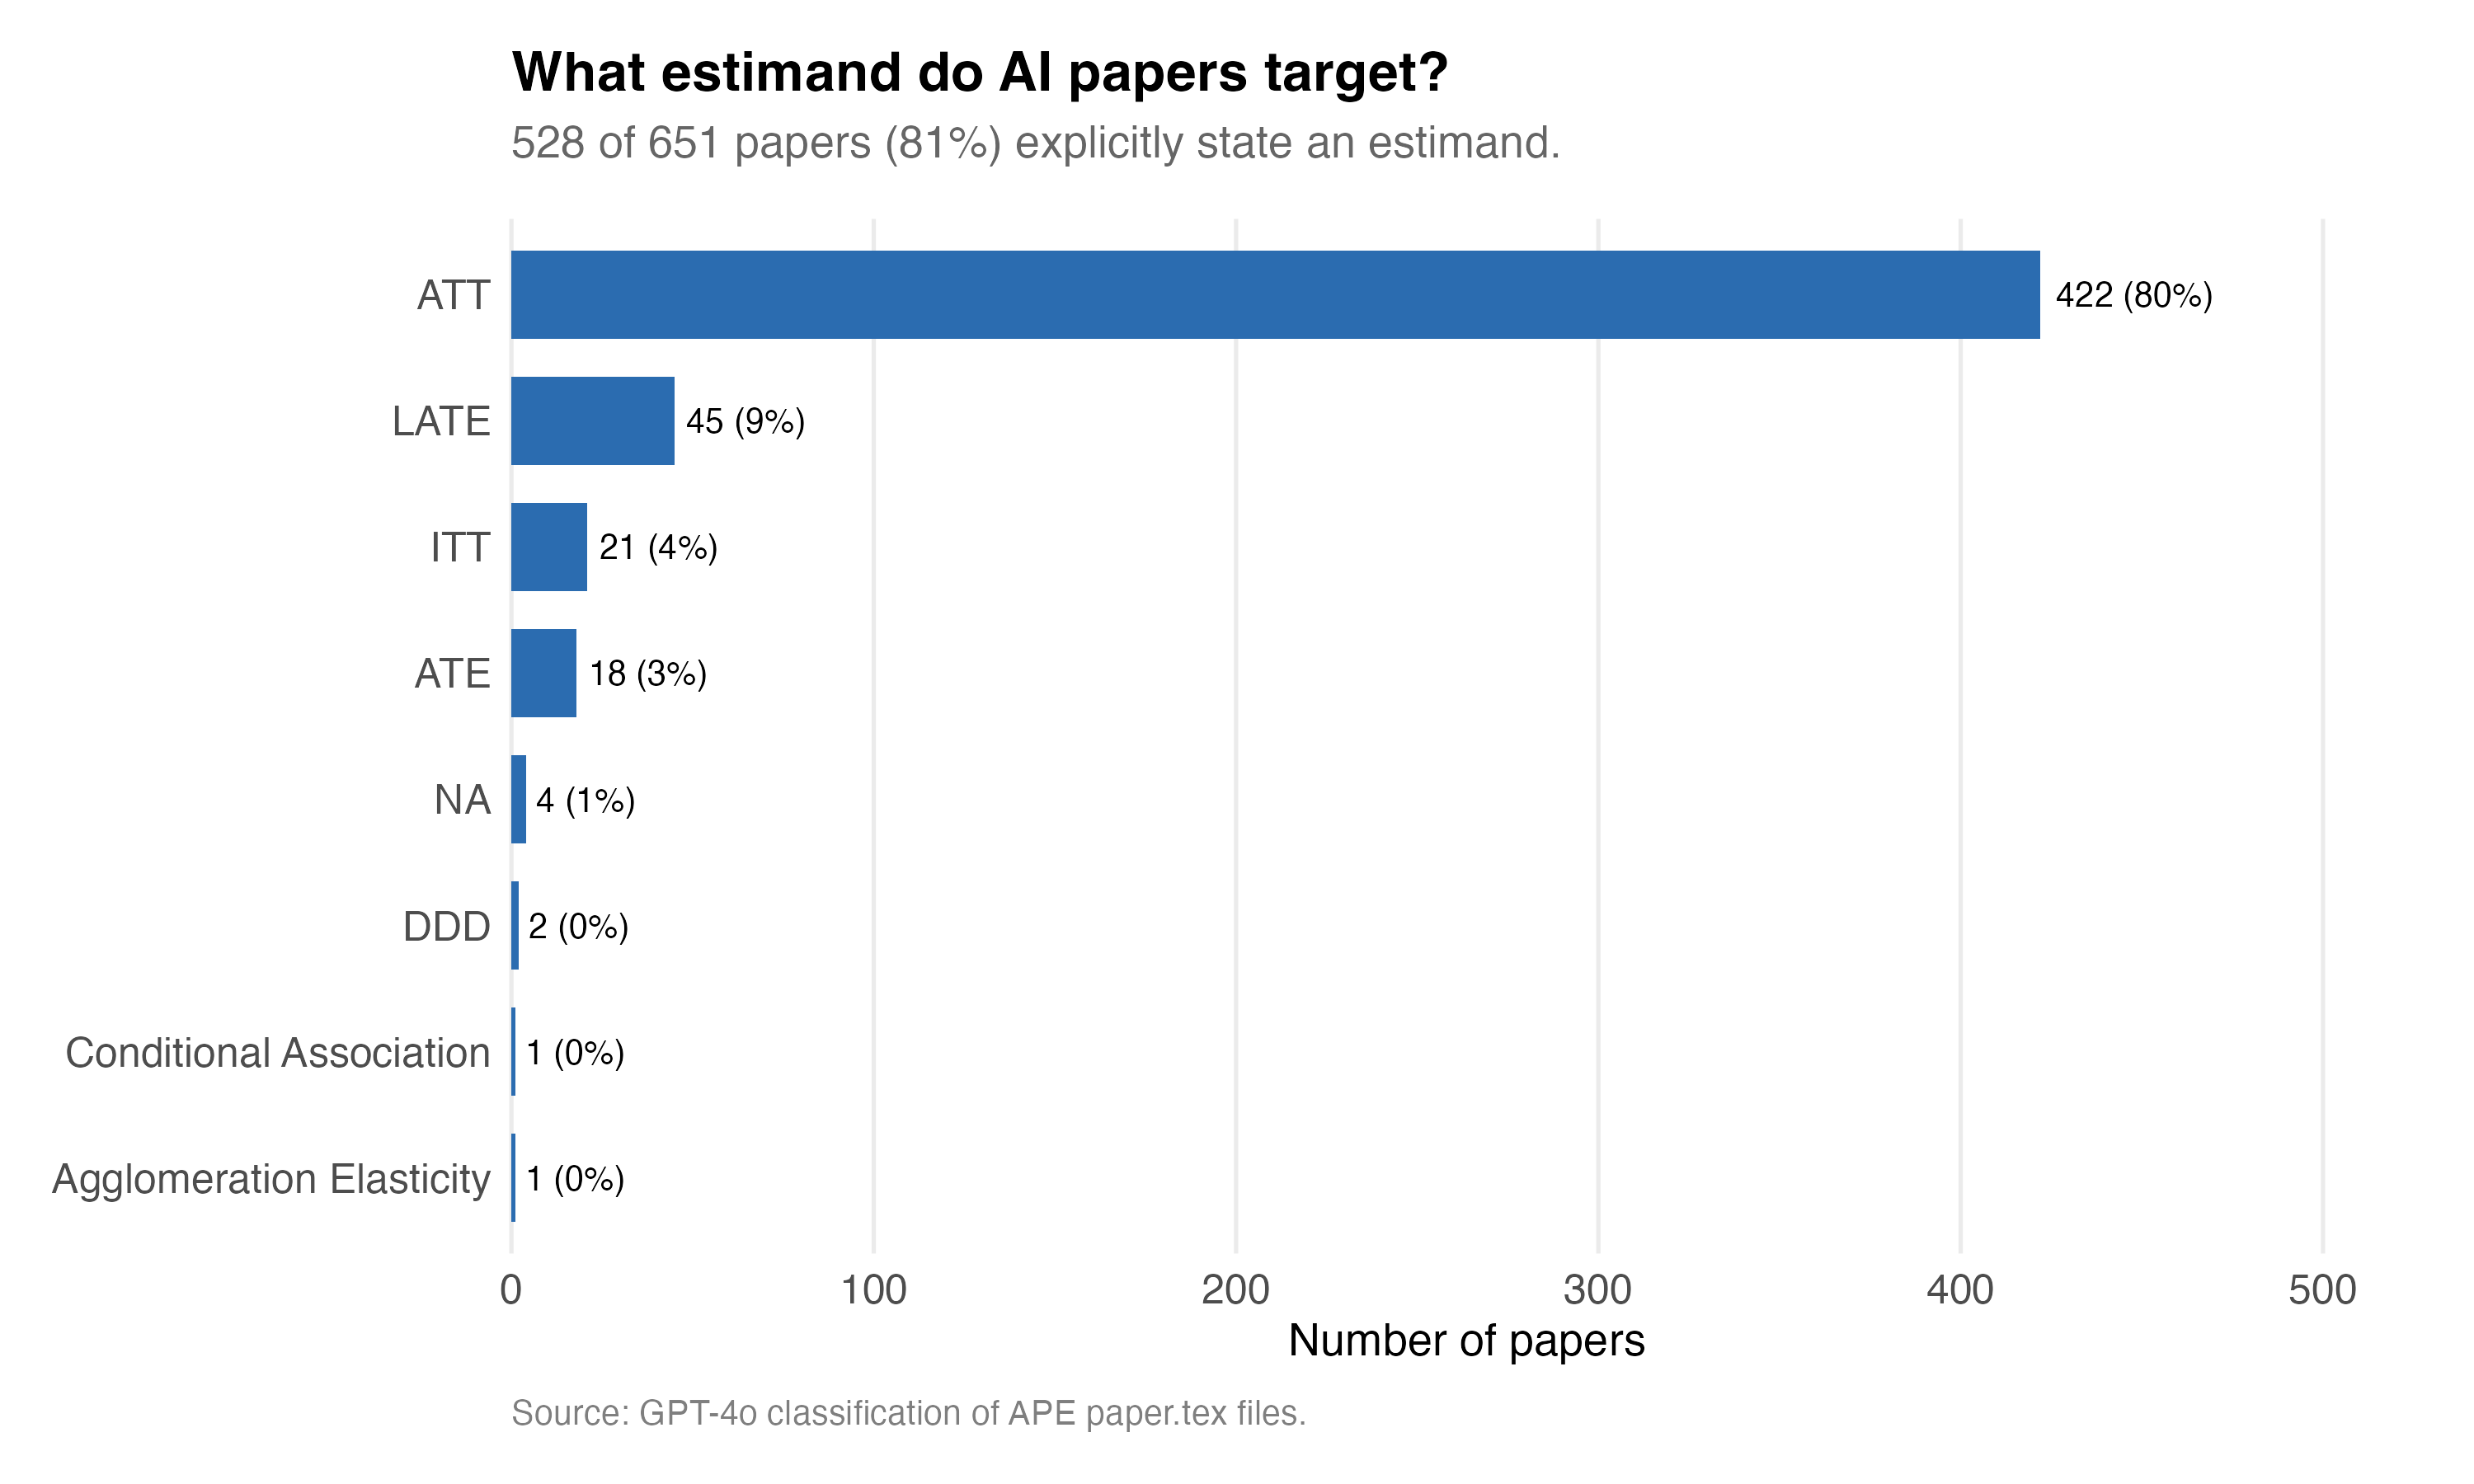
The ATT is interestingly the most common parameter of interest. Which is interesting in a sense because by revealed preference, one could argue that AI agents believe that the ATT is the most important policy parameter we could be interested in. And frankly, I am probably in that camp too.
I’m not sure I would say that the DDD is an estimand, though one could in the population of course run a triple diff and that triple interaction would have a calculation behind it that is a population quantity without any uncertainty behind it. But I’m not sure if in fact that is what GPT-4o means here. Nonetheless, 422 of the papers mention the ATT, but 45 mention the LATE — which again is sort of strange given GPT-4o also said only 20 of these papers should be classified as IV.
So lots of mystery, and I am curious what is going on, but for now I’m going to have to save that for another day. The more general thing I will say is that it is decidedly modern when you think about it that AI Agents are being this precise up front about what they are going after. Because a lot of people historically did not. They would associate the regression coefficient as the estimand, which is definitely a calculation, but it is also an estimator probably, and it is also probably an estimate in a sample. But here we do appear, via the causal jargon, getting an expression of the estimand, which I think is itself fairly scientifically and methodologically correct to do it that way. The papers appears to be being clear about what they are running after.
I also had GPT-4o do a second analysis of the papers just to get a bit more information about them on this point. And here’s what it found the second time.
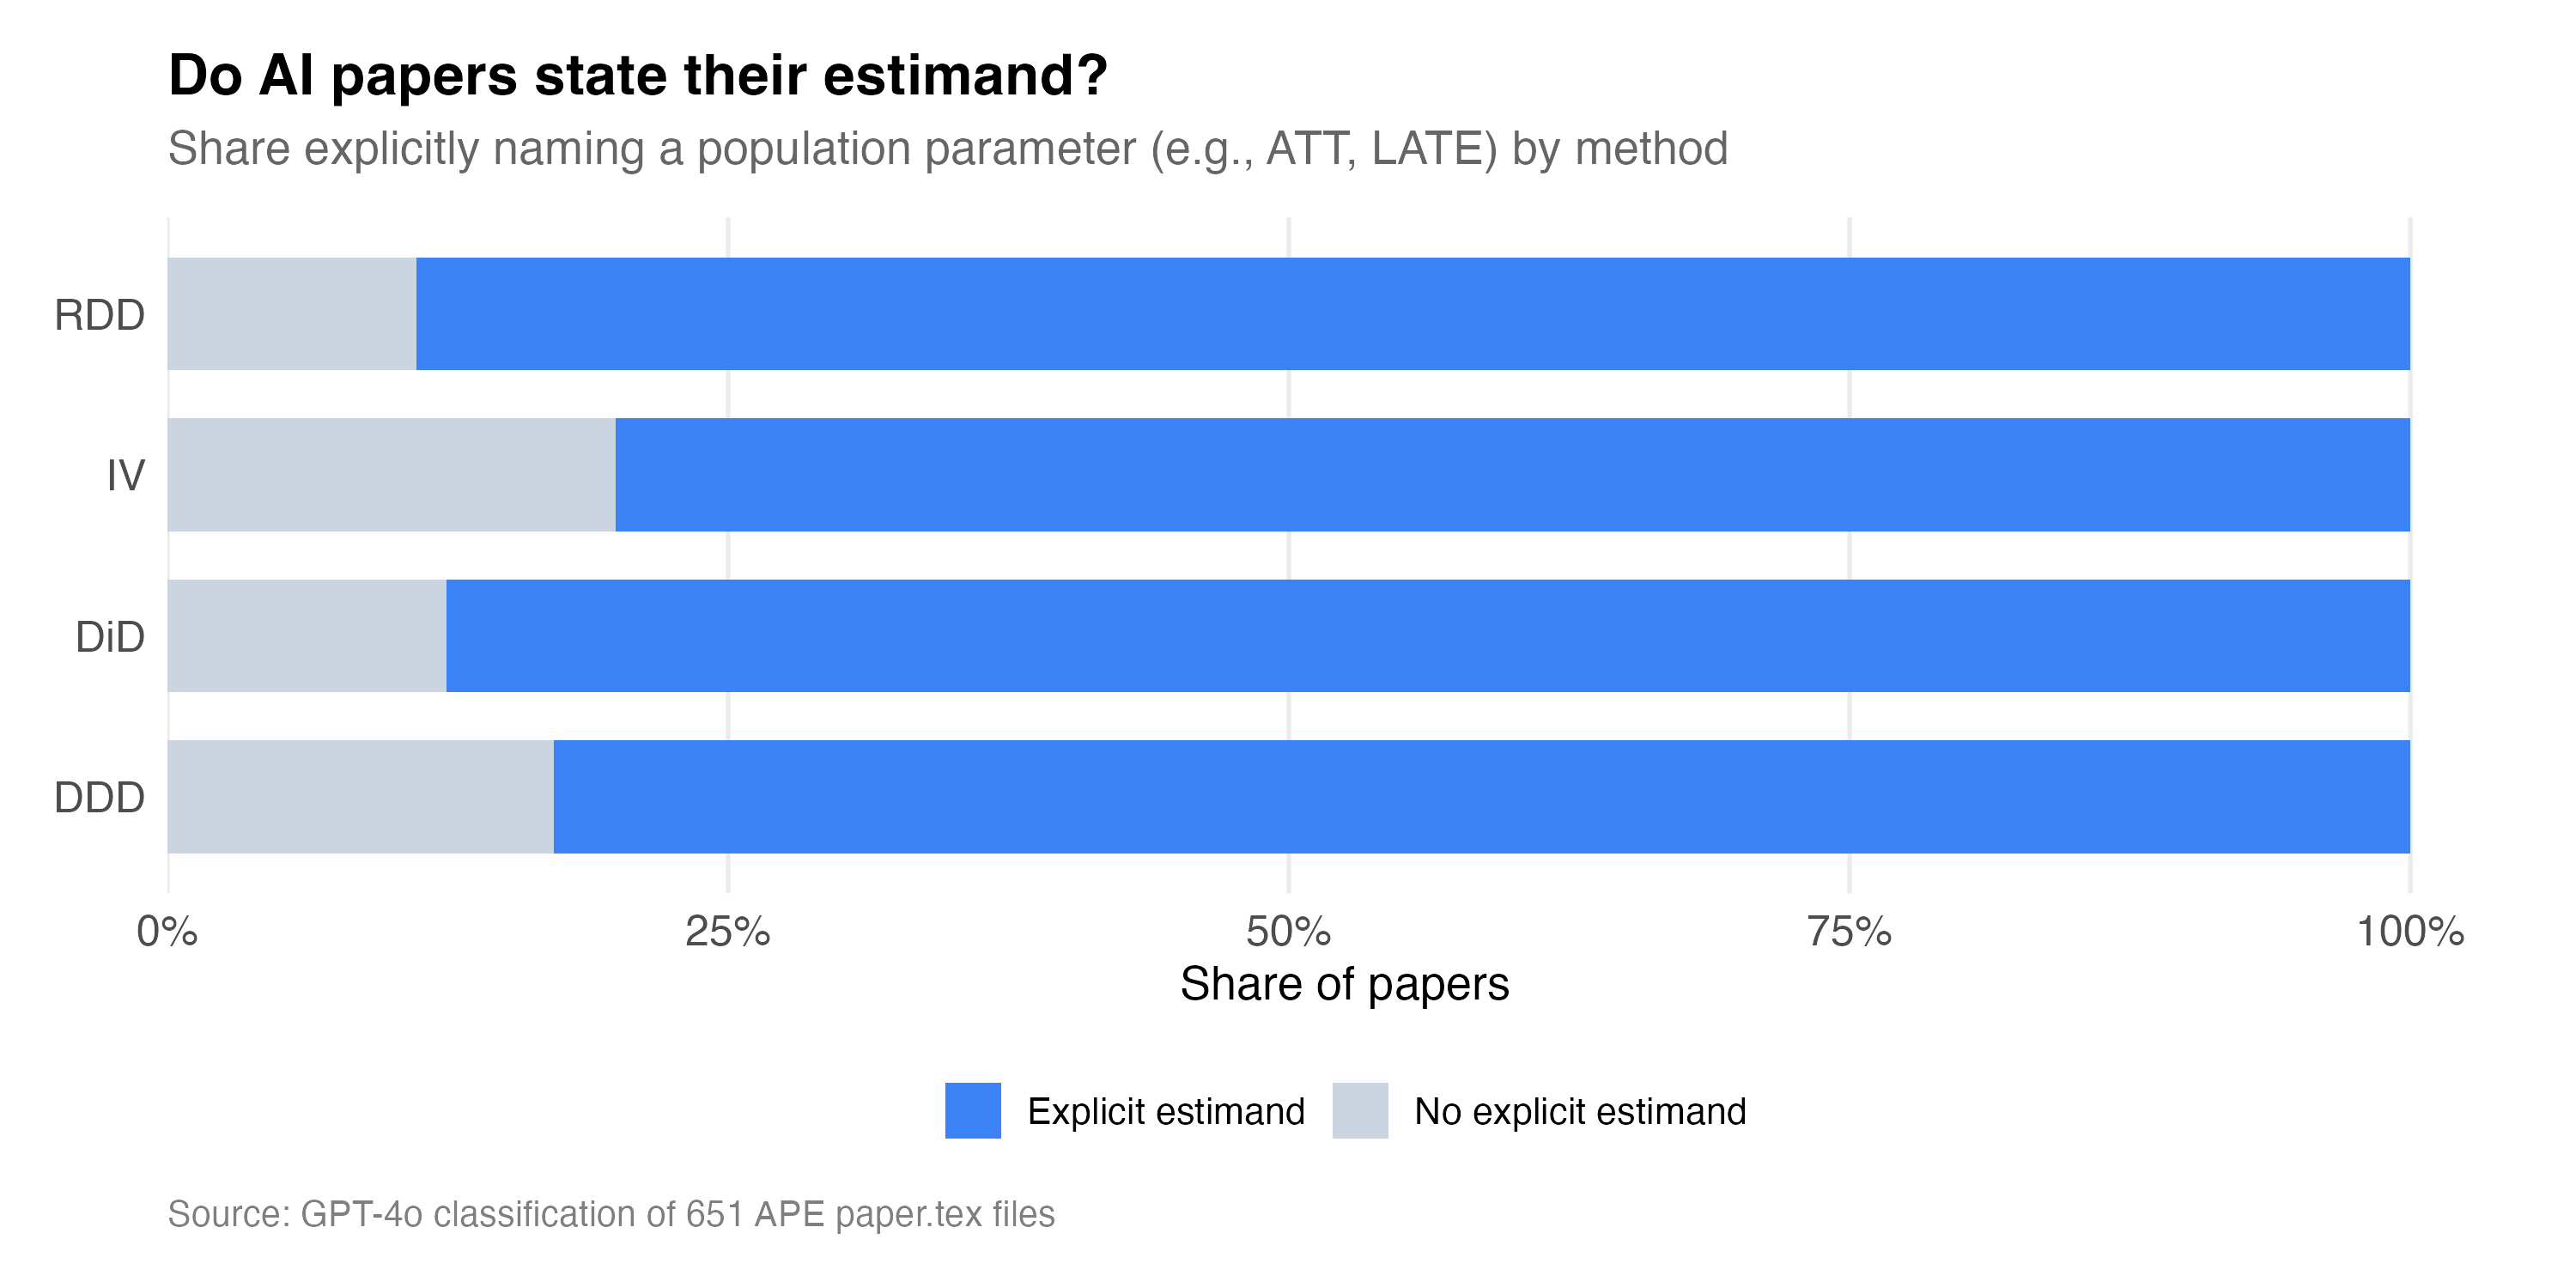
So interestingly, the overwhelming case is that AI agents name the estimand.
Units of Measurements in DD
So what is the unit of observation in the diff-in-diff papers — both the panel unit and the time unit. And this was pretty interesting and confirmed my priors. These are basically vanilla state-year panels. Why? Because 148 of them are state panels, which almost certainly are also yearly data.
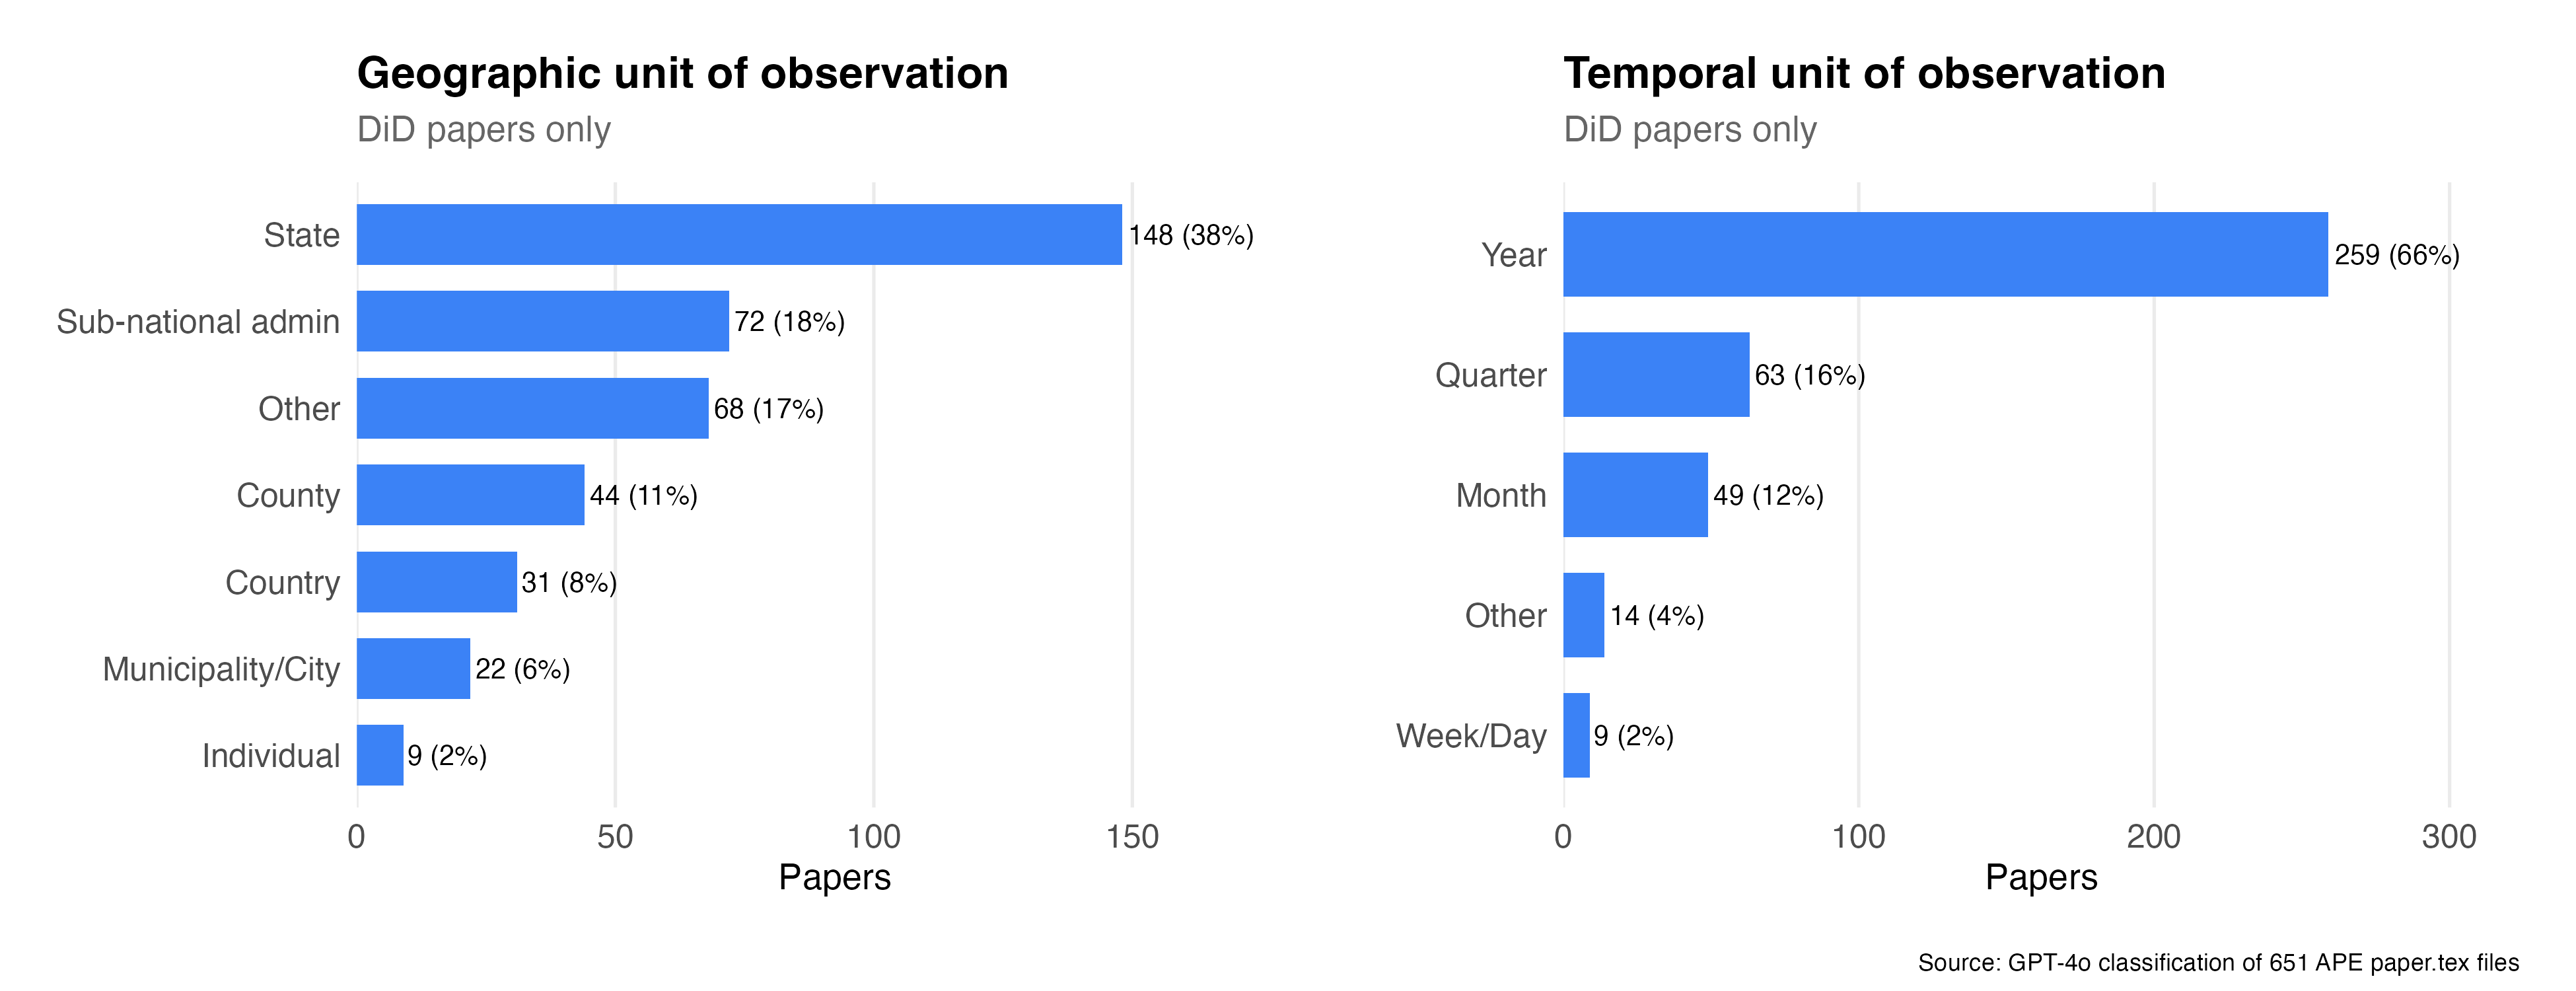
But nevertheless there is actually more variation in here than I was expecting. There are 44 papers using county level data, and 22 using city level data. Nine of them got their hands on individual level data. All of this was publicly available data mind you.
The panel time dimension is far more skewed towards manual data, though there is some variation there too.
Reminder of Statistical Significance Principles
On my third request to OpenAI, I asked GPT-4o to extract the coefficients and standard errors from all the regressions and place them in a simple JSON. Why didn’t I do that on the first two pulls? Well funny story — I thought I did. Anyway, I didn’t, so I had to do it again. This cost around 70 cents.
Before I get into this let me share a little about one of the more common ways that researchers try to check if there is evidence for p-hacking. They look at density plots and check whether there is bunching at the 95% critical values associated with the normal distribution.
Specifically, 95% of all probability mass in the normal is located within 1.96 standard deviations from the mean. The t-statistic has a sampling distribution and when that value exceeds 1.96, you can say it is in the tails of the normal (on one side, it’s in the top 2.5%). Not impossible but considered to be extreme and as it’s measurable, a way we have historically stated something could or could not reject a null hypothesis.
And the p-value is the probability of observing a t-statistic as extreme or more extreme than the one you got, assuming the null is true. So if |t| = 1.96 in a two-sided test, then 5% of the sampling distribution lies in both tails combined — 2.5% above 1.96 and 2.5% below -1.96. That’s the p-value: 0.05.
So, in these forensic style plots, if we see an unusual bunching of estimates around 1.96, it’s thought to be a sign of p-hacking as it’s not really got an alternative explanation as to why estimates would bunch at 1.96 but not 1.76.
Are AI Agents p-hacking? Yes.
Okay, then what did we find. Are AI Agents p-hacking? And the answer is they are p-hacking the crap out of these papers! What I see. Are AI agents p-hacking? In a word: yes. Or at least the pattern is consistent with it. The median t-statistic across all papers is 1.94 — almost exactly the significance threshold. Only 49.8% of coefficients are significant at 5%, which sounds reasonable until you notice that the distribution has a suspicious discontinuity right at the threshold.

This zoomed figure is striking. There is a very visible spike right at t = 1.96. The overall density is declining smoothly through t = 1.5, 1.6, 1.7, but then POW — a noticeable jump right at the threshold for conventional statistical significance. Let me be even more specific than that.
In a 0.2-wide window, there are 135 t-statistics just below 1.96 and 205 just above — a ratio of 1.52. That means 52% more mass just above the significance threshold than just below. For comparison, Brodeur et al. (2020) found a ratio of about 1.4 for human papers in top economics journals. So it’s p-hacking slightly worse than us!
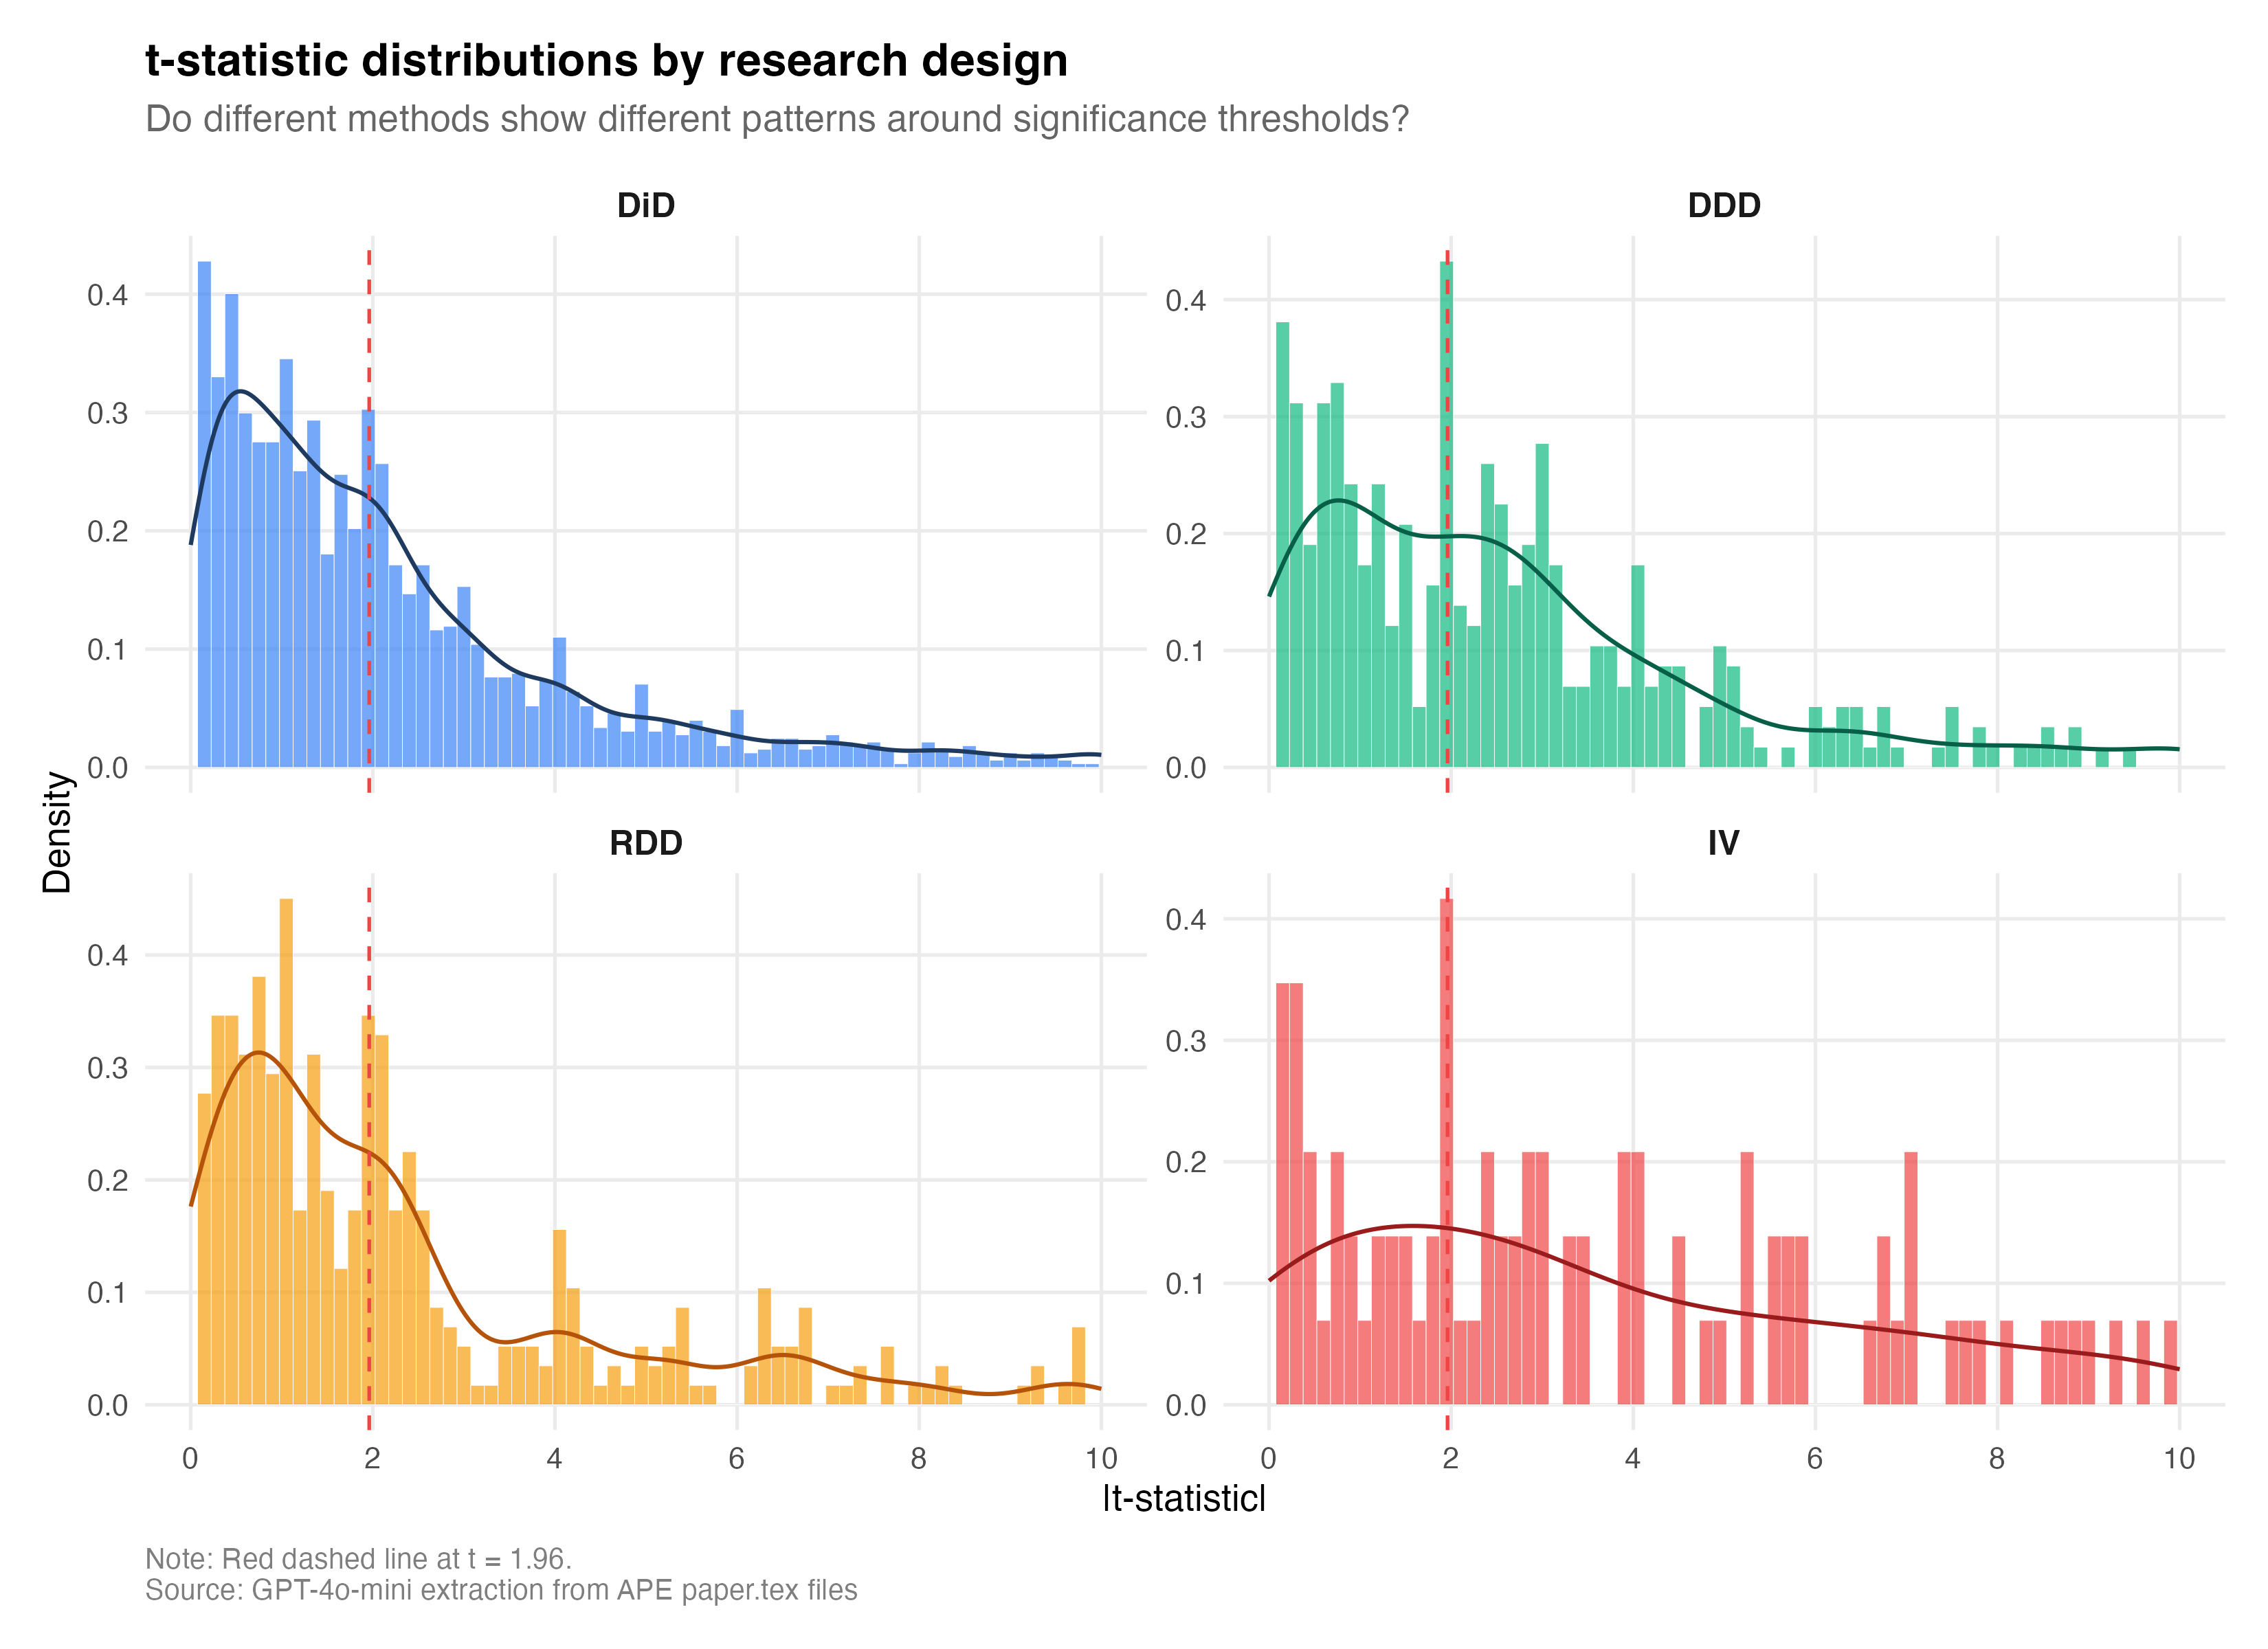
But here’s the really interesting part. When you break it down by method, which is something Brodeur has done before, the IV papers have the worst bunching ratio: 3.5. There are 3.5 times more t-statistics just above 1.96 than just below for IV papers. Now the sample is for IV is small. Only 20 papers out of 651 are classified as IV, and yet those 20 papers show by far the strongest bunching signature. The AI learned from a literature where IV papers were the most aggressively selected, and it reproduced that selection faithfully.
But the really bad ones are DiD and RDD. The ratio for DiD is 1.5, and it is 1.87 for RDD. This is exactly the ordering you’d predict if the AI learned from the human literature because Brodeur et al. found that IV papers had the worst p-hacking, which is what we find her. But I think Brodeur et al. did not find this severe of RDD bunching at the critical values.
Now here’s the crazy thing. AI is stating its explicit estimand. It’s choosing a design. It’s using publicly available data. It’s cleaning it. Its code is published on GitHub. And yet it appears that it’s p-hacking because we have the full distribution of the papers, and we have bunching at statistical significance thresholds without any motivation to publish!
Think about that for a second. These agents are not being incentivized to publish. They are not being told to find statistically significant results. They are merely being told via a prompt to work on particular topics using real data which must be cleaned, and so forth, and yet there appears to be a collective process at work that is causing p-hacking.
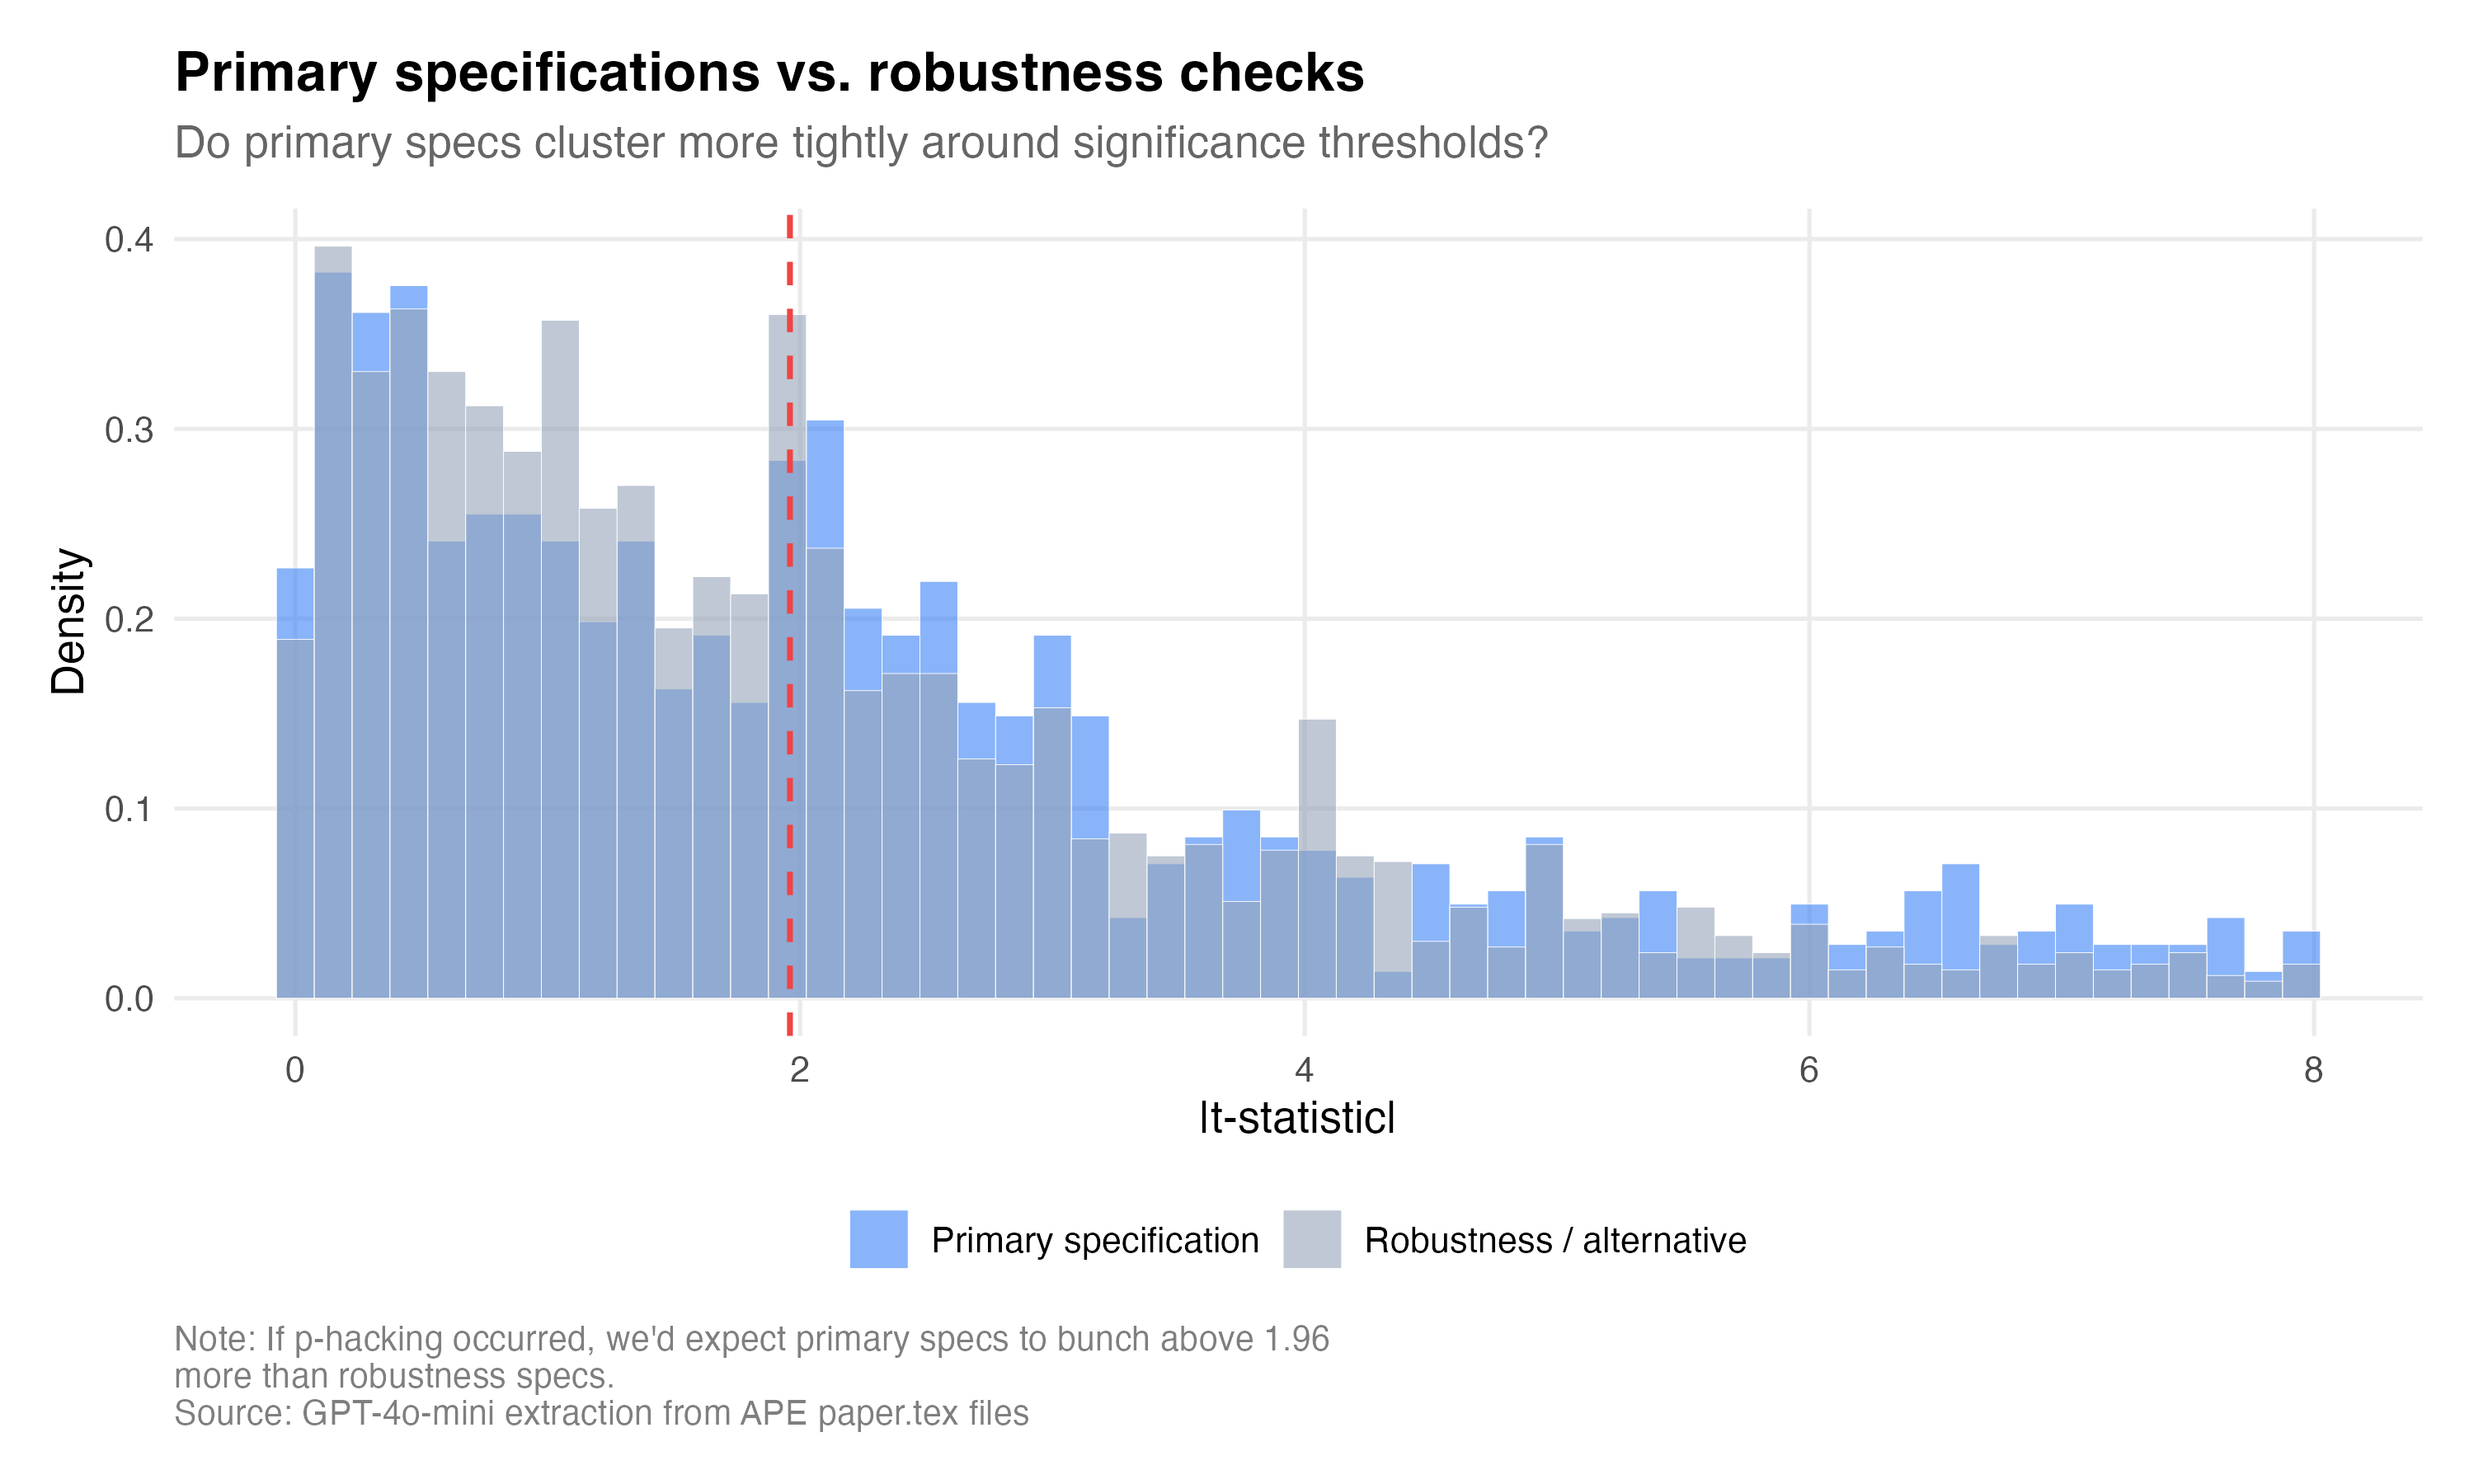
The primary vs. robustness figure tells a related story. The primary specifications cluster more tightly near 1.96 than the robustness checks, which are more dispersed. Maybe this is what you’d expect because maybe the agent picks its “main result” in part based on significance, and the robustness checks are whatever they happen to be. We don’t really know all that went into the actual coding part of this — we just know the final result, and the final code itself. We do not know how the sausage was made, only that it was made.
Now, this isn’t p-hacking in the way humans do it. A human researcher might run 50 specifications and report the one that’s significant. The AI agent doesn’t have that latitude, though; its pipeline is deterministic. But what it does have is a training corpus. It appears to have learned what “good” results look like from millions of published papers, and published papers are already p-hacked. So when the AI agent writes a paper and selects which results to emphasize, it’s reproducing the distributional signature of p-hacking even if the mechanism is different. It’s mimicking the output of a p-hacked literature because that’s what it thinks a paper looks like.
Conclusion
I asked Claude to calculate how much we spent on this, because I lost track of how many times I sent these papers back to OpenAI for classification. To get 651 full manuscripts classified by GPT-4o in batch at OpenAI cost $12.28.
That’s $12.28 for everything in this Substack post.
It is $11.59 for GPT-4o to read all 651 papers and classify each paper’s research design, their estimators, descriptions of the paper’s rhetoric, data sources, and the stated (or not) estimand. And it cost another $0.69 for GPT-4o-mini to extract 3,510 coefficients and standard errors for the p-hacking analysis.
What a crazy world it is. P-hacking AI agents writing papers just like us.
Can you envision a pathway for training this out of models with a corpus of null-result papers, or would it be easier to accomplish with explicit instructions?
(Obviously the pool of fully written/tabled/figured/rhetoricized papers on null results is super-small, but the null/negative results journal movement got some stuff out there).
I wonder where the AI agents learned to do this...