Well, I have Covid. I guess I caught it on my travels. So my plans for today’s substack shortened from what I was originally planning, which was more simulations. I’ve got a pounding headache and slept for 20 hours, so I’m just going to go with something more manageable.
Ever read a paper that was incredibly specific and yet completely unreadable? Ever read a paper that was readable but which left you with way more questions than answers (and not in a good way)? They’re each different kinds of problems on the same challenge we have in writing scientific manuscripts. This substack today is going to be very specific about the balancing act between readability and accuracy but I’m only going to talk about difference-in-differences as it’s too big a problem too bite off on. But I think by the end, it’ll be clear that everything I say applies to every article, and probably applies to every conversation we ever have with others.
State your target parameters
To keep this massive topic about scientific rhetoric manageable, I’m going to focus on just a couple of things. I’m only going to start off by suggesting that we need to be more specific about what our research questions are as this is what drives the methods that you use.
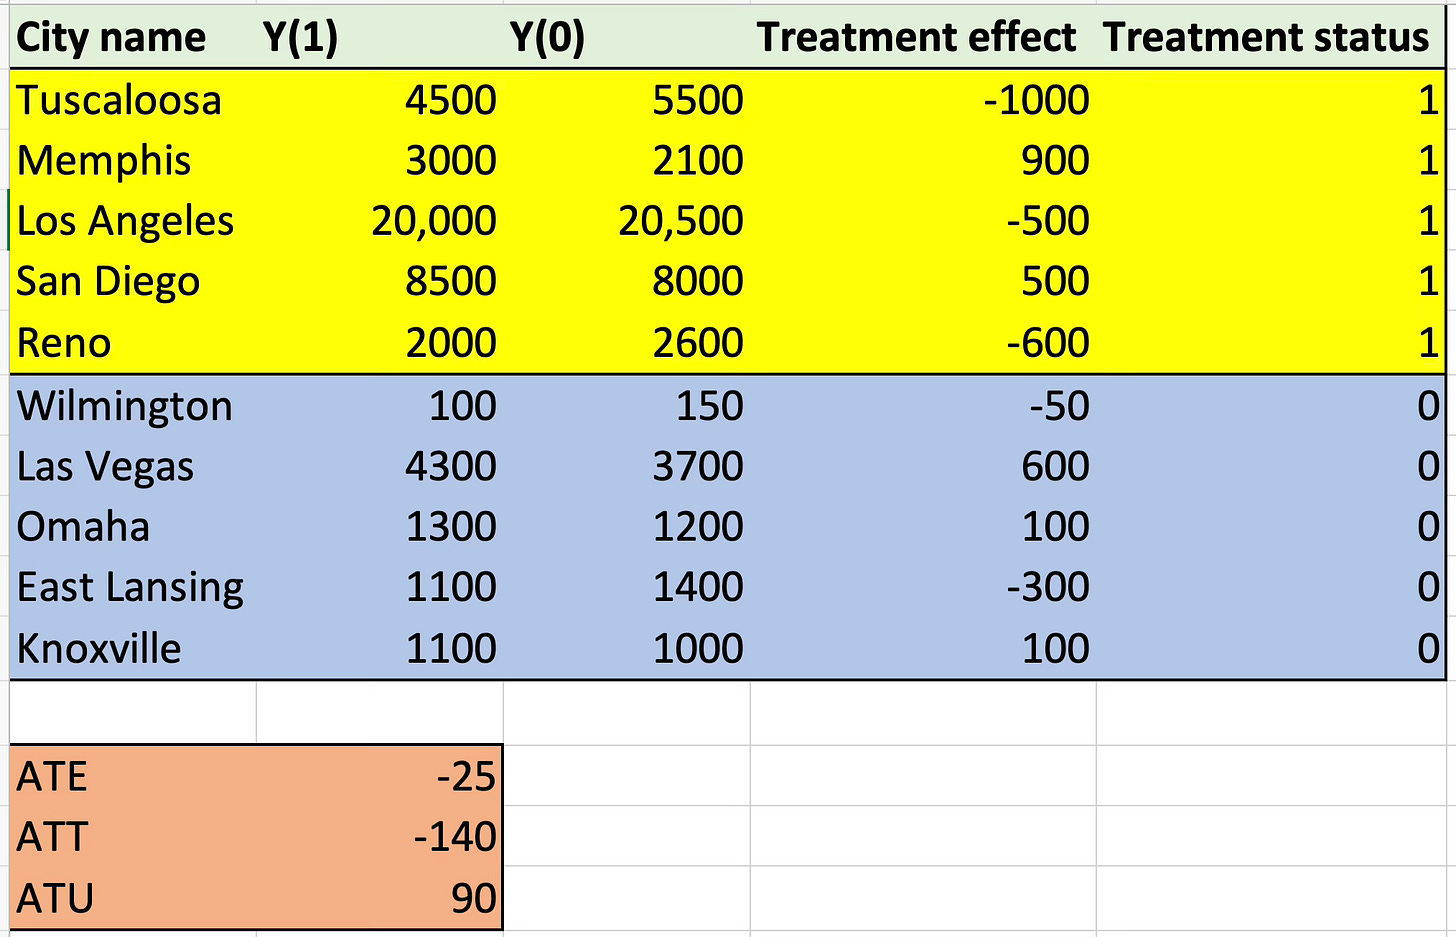
You may be saying “Isn’t my research question to estimate the causal effect of gun control on gun violence?” or some equivalent. The answer is yes and no. Yes, it is that, but it also isn’t that because there technically isn’t one causal effect, so the adjective “the” isn’t quite accurate. It helps to have a picture of what I mean. Imagine 10 cities and an imaginary unnamed treatment. Cities could be treated or not treated. If they are treated with this policy, then their outcome is Y(1) and if they aren’t then Y(0).
Ten cities, ten causal (or treatment) effects. Not every city has the same response to the treatment, and not every city even has the same qualitative response. Five of the cities are hurt, five are helped. The yellow cities are treated and the blue ones aren’t.
See how there is no “the causal effect”? There are rather ten city-specific treatment effects (already some aggregation over the people who live there). And the average treatment effect across all ten cities is -25. How so? Because if you take the average of the treatment effect column, it’s -25. And that’s the ATE.
But you can summarize those ten treatment effects in other ways too. You can for instance summarize them by taking the average of the yellow cities — i.e., the treated cities. And that’s -140. Why? Because take the average of the treatment effect column for the yellow cities, and it’s equal to -140. And that’s called the average treatment effect for the treated cities, or ATT.
And then there is the lesser known but still equally as important last summary — the average treatment effect for the blue cities, or rather, the untreated cities. That’s +90. And if you take the average of 90 and -140, you get -25, which is the ATE because the ATE is the weighted average of the ATT and the ATU.
See, once you end up in the world of potential outcomes, things get a little weird. There’s 10 cities, but only 5 of them were treated. And yet, the ATE is not for those 5 cities — it’s for all the cities. And if you wanted to know the ATU, which is the average effect of the policy in the 5 cities that didn’t get it, you absolutely could make that your research question. That’s no less bizarre a question than to ask the ATT or the ATE. All three of them are seemingly impossible tasks of fiddling with fiction. You get to decide what your research question is. But whatever it is, it has a specific target parameter, and that way you know what your target parameter is, you just have to ask “which populations’ treatment effects do I want to summarize?” That’s how you know. The target parameter in causal inference is the summarizing of some selected group of units’ treatment effects, so all you have to do when setting out to talk this way in your research is clearly say which units you are trying to summarize and which units you aren’t. And if it’s all of them, great — that’s the ATE. But if it’s only the ones treated, that’s the ATT.
The reason this is important is because diff-in-diff only identifies the ATT. Synthetic control only identifies the ATT. Matrix completion only identifies the ATT. But randomized experiments identify the ATE, and instrumental variables identifies the LATE. So you see how it actually matters? Comparing results across studies gets increasingly difficult if they use different methods but study the same dataset and same policy instrument, even, if there’s heterogeneity and it varies by treatment status. And this is a topic for another day, but for now, the focus is much simpler — state your parameter up front. Reason is, your target parameter is what drives your choice of the method. If you aren’t interested in the ATT, don’t use diff-in-diff. But if you are, then diff-in-diff is on the table. Doesn’t guarantee you can use diff-in-diff of course, as there’s still the awful job of attempting to convince yourselves and others that the assumptions for that method hold, but my point is before that — state your research question as a target parameter which means being specific about which populations you are studying.


